. 2000 May;105(9):1243-52.
doi: 10.1172/JCI8341.

Pathophysiological role of leptin in obesity-related hypertension

Affiliations

Pathophysiological role of leptin in obesity-related hypertension

M Aizawa-Abe et al. J Clin Invest. 2000 May.

Abstract

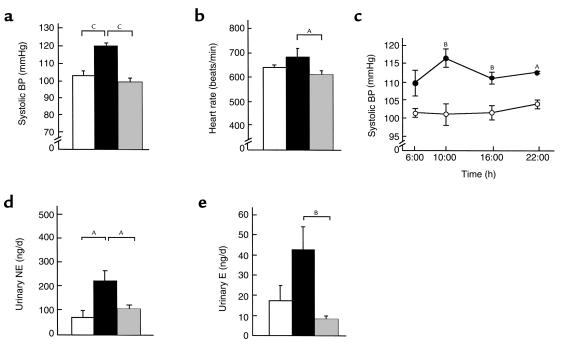
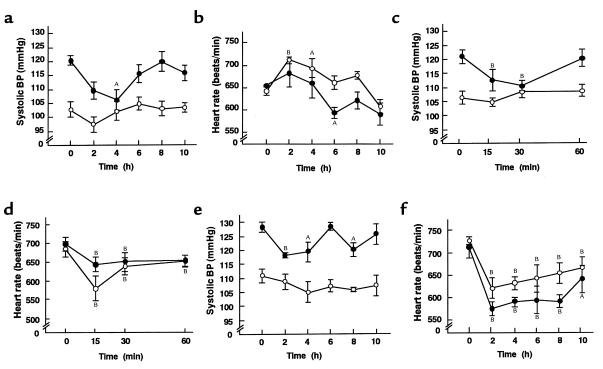
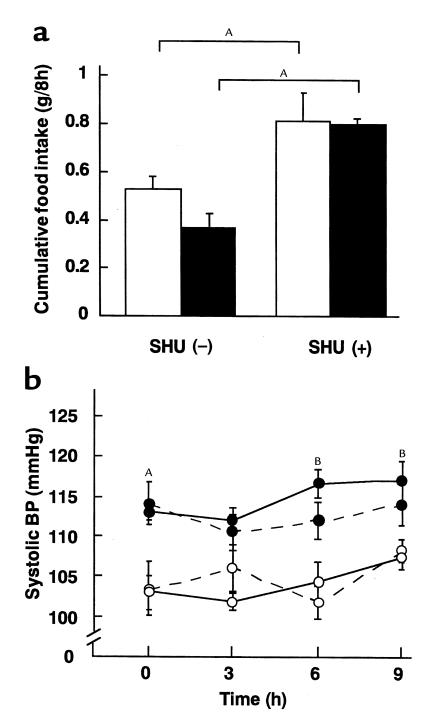
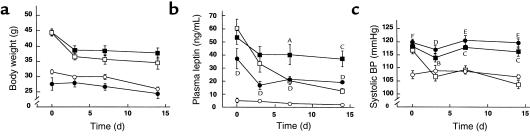
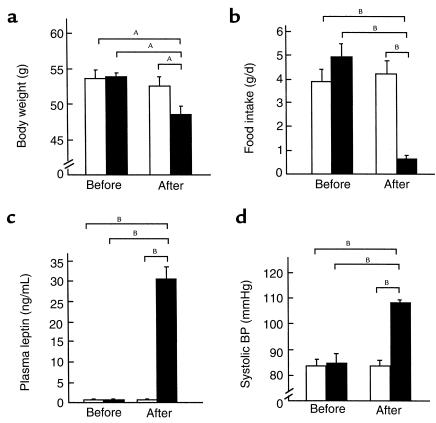
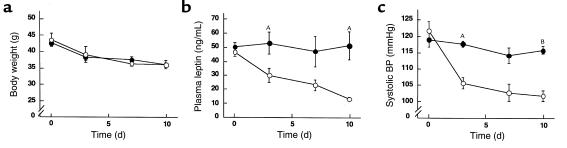
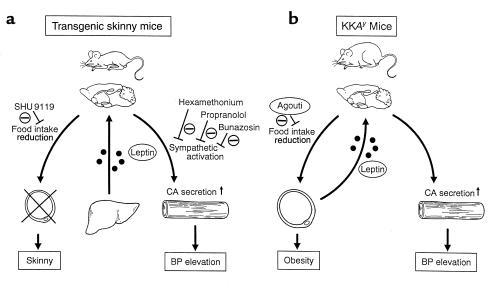
To explore the pathophysiological role of leptin in obesity-related hypertension, we examined cardiovascular phenotypes of transgenic skinny mice whose elevated plasma leptin concentrations are comparable to those seen in obese subjects. We also studied genetically obese KKA(y) mice with hyperleptinemia, in which hypothalamic melanocortin system is antagonized by ectopic expression of the agouti protein. Systolic blood pressure (BP) and urinary catecholamine excretion are elevated in transgenic skinny mice relative to nontransgenic littermates. The BP elevation in transgenic skinny mice is abolished by alpha(1)-adrenergic, beta-adrenergic, or ganglionic blockers at doses that do not affect BP in nontransgenic littermates. Central administration of an alpha-melanocyte-stimulating hormone antagonist causes a marked increase in cumulative food intake but no significant changes in BP. The obese KKA(y) mice develop BP elevation with increased urinary catecholamine excretion relative to control KK mice. After a 2-week caloric restriction, BP elevation is reversed in nontransgenic littermates with the A(y) allele, in parallel with a reduction in plasma leptin concentrations, but is sustained in transgenic mice overexpressing leptin with the A(y) allele, which remain hyperleptinemic. This study demonstrates BP elevation in transgenic skinny mice and obese KKA(y) mice that are both hyperleptinemic, thereby suggesting the pathophysiological role of leptin in some forms of obesity-related hypertension.


Figures

Figure 1
Figure 1
Profiles of transgenic skinny mice, ob/ob mice, and their control mice. Systolic BP (a) and heart rate (b) in 12-week-old transgenic skinny mice (black bars), ob/ob mice (shaded bars), and their control mice (open bars). (c) Daily profile of systolic BP in 12-week-old transgenic skinny mice (filled circles) and nontransgenic littermates (open circles). Urinary NE (c) and E (d) excretion levels in 12-week-old transgenic skinny mice (filled bars), ob/ob mice (shaded bars), and their control mice (open bars). AP < 0.05, BP < 0.01, and CP < 0.001 compared with control mice assessed by 1-way ANOVA with Bonferroni Dunn test (a, b, d, e), and by ANOVA with repeated measures analysis with Student’s t test at a given time (c).
Figure 2
Figure 2
Effects of sympathetic blockades on systolic BP and heart rate in 12-week-old transgenic skinny mice and nontransgenic littermates. Effect of bunazosin on systolic BP (a) and heart rate (b). Effect of hexamethonium on systolic BP (c) and heart rate (d). Effect of propranolol on systolic BP (e) and heart rate (f). AP < 0.05 and BP < 0.01 compared to the initial values.
Figure 3
Figure 3
Effects of SHU9119 on cumulative food intake and systolic BP in 12-week-old transgenic skinny mice and nontransgenic littermates. (a) Effect of SHU9119 on cumulative food intake in transgenic skinny mice (filled bars) and nontransgenic littermates (open bars). AP < 0.05 compared with vehicle-treated groups. (b) Effect of SHU9119 on systolic BP in transgenic skinny mice (filled circles) and nontransgenic littermates (open circles). Mice treated with and without SHU9119 are depicted by solid and dotted lines, respectively. AP < 0.05 and BP < 0.01 compared with SHU9119-treated nontransgenic littermates.
Figure 4
Figure 4
Effects of a 2-week caloric restriction on body weights, plasma leptin concentrations, and systolic BPs in 12-week-old F1 animals (+/+, Tg/+, Ay/+, and Tg/+:Ay/+ mice). (a) Time course of body weights of +/+ (open circles), Tg/+ (filled circles), Ay/+ (open boxes), and Tg/+:Ay/+ (filled boxes) mice during the caloric restriction. (b) Time course of plasma leptin concentrations in +/+ (open circles), Tg/+ (filled circles), Ay/+ (open boxes), and Tg/+:Ay/+ (filled boxes) mice. (c) Time course of systolic BPs in +/+ (open circles), Tg/+ (filled circles), Ay/+ (open boxes), and Tg/+:Ay/+ (filled boxes) mice. DP < 0.05, EP < 0.01, and FP < 0.001 (Tg/+ mice compared with +/+ mice), and AP < 0.05, BP < 0.01, and CP < 0.001 (Tg/+:Ay/+ mice compared with Ay/+ mice) assessed by ANOVA with repeated measures analysis with Student’s t test at a given time.
Figure 5
Figure 5
Effects of a 3-day leptin administration on body weights, plasma leptin concentrations, and systolic BPs in 12-week-old male ob/ob mice and control littermates. (a) Body weights of ob/ob mice before and 3 days after the treatment. (b) Food intake of ob/ob mice before and 3 days after the treatment. (c) Plasma leptin concentrations in ob/ob mice before and 3 days after the treatment. (d) Systolic BPs of ob/ob mice before and 3 days after the treatment. The ob/ob mice treated with leptin or vehicle are indicated by filled and open bars, respectively. AP < 0.05, BP < 0.01 versus vehicle-treated groups assessed by ANOVA with repeated measures analysis with Student’s t test.
Figure 6
Figure 6
Effects of chronic leptin administration on BPs in 12-week-old male Ay/+ mice during a 10-day caloric restriction. (a) Time course of body weights of Ay/+ mice treated with leptin or vehicle. (b) Time course of plasma leptin concentrations in Ay/+ mice treated with leptin or vehicle. (c) Time course of systolic BPs in Ay/+ mice treated with leptin or vehicle. The Ay/+ mice treated with leptin or vehicle are indicated by filled and open circles, respectively. AP < 0.05, BP < 0.001 versus vehicle-treated groups assessed by ANOVA with repeated measures analysis with Student’s t test at a given time.
Figure 7
Figure 7
Possible mechanisms for the leptin-induced BP elevation in transgenic skinny mice (a) and KKAy mice (b). In transgenic skinny mice (a), leptin is oversecreted ectopically from the liver into the circulation, which causes the skinny phenotype with decreased food intake and a significant BP elevation with increased catecholamine production. They are hypoinsulinemic with hypersensitivity to insulin (28). Decrease in food intake is reversed by SHU9119, whereas BP elevation is not abolished by SHU9119 but by bunazosin, propranolol, and hexamethonium. In KKAy mice (b), leptin is oversecreted from the adipose tissue into the circulation, which causes significant BP elevation with increased catecholamine production, although they are hyperphagic owing to the antagonism of hypothalamic melanocortin system by the agouti protein. They are hyperinsulinemic with marked resistance to insulin (30, 31). CA, catecholamine.

References

    1. Kannel WB, Brand M, Skinner JJ, Jr, Sawber TR, McNamara PM. The relation of adiposity to blood pressure and development of hypertension: the Framingham study. Ann Intern Med. 1967;67:48–59. - PubMed
    1. Reaven GM. Role of insulin resistance in human disease. Diabetes. 1988;37:1595–1607. - PubMed
    1. Landsberg L, Krieger DR. Obesity, metabolism, and the sympathetic nervous system. Am J Hypertension. 1989;2:125S–132S. - PubMed
    1. Mark AL, Correia M, Morgan DA, Shaffer RA, Haynes WG. Obesity-Induced Hypertension : New Concepts From the Emerging Biology of Obesity. Hypertension. 1999;33:537–541. - PubMed
    1. Rocchini AP, et al. The effect of weight loss on the sensitivity of blood pressure to sodium in obese adolescents. N Engl J Med. 1989;31:580–585. - PubMed

Publication types

MeSH terms