

PAC1 receptor-deficient mice display impaired insulinotropic response to glucose and reduced glucose tolerance
- PMID: 10792006
- PMCID: PMC315446
- DOI: 10.1172/JCI9387
PAC1 receptor-deficient mice display impaired insulinotropic response to glucose and reduced glucose tolerance
Abstract
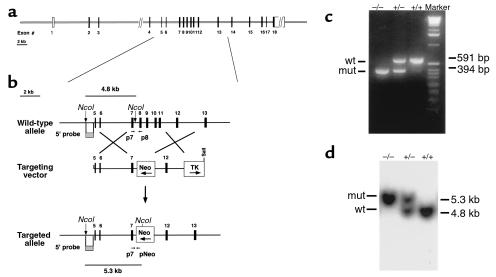
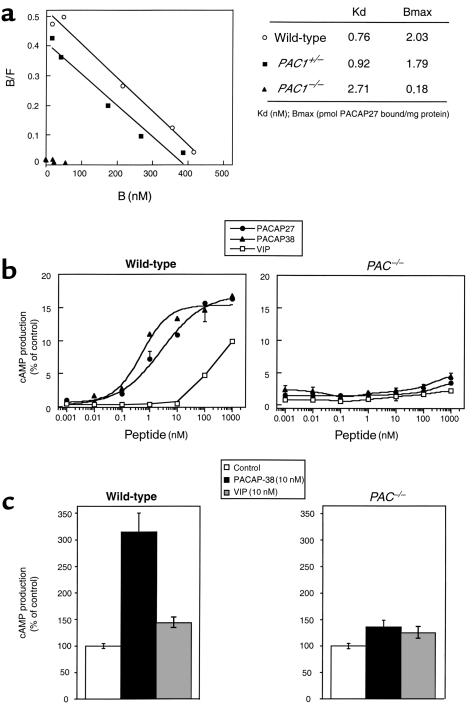
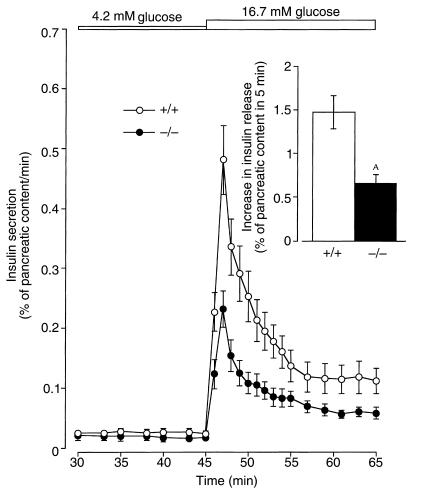
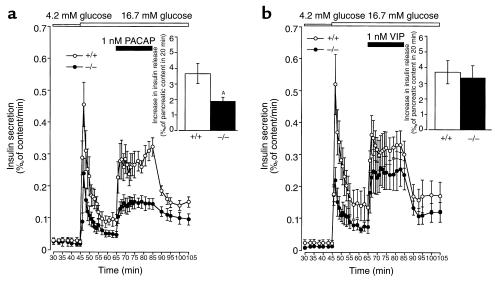
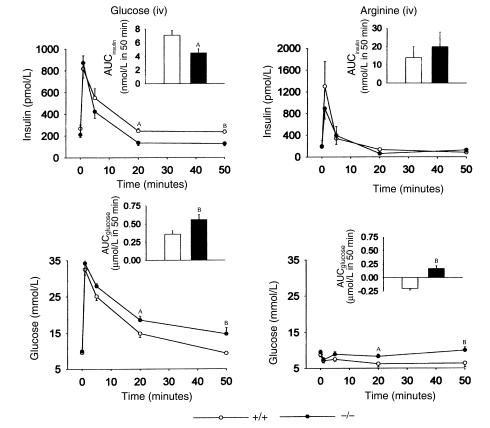
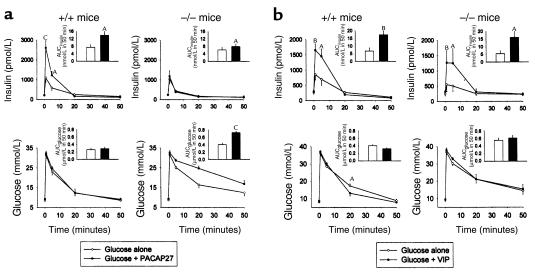
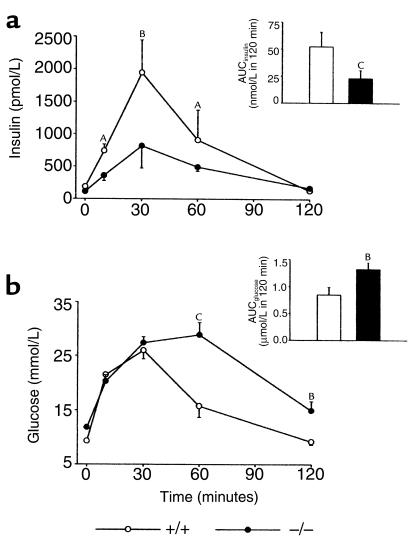
Pituitary adenylate cyclase-activating polypeptide (PACAP) is a ubiquitous neuropeptide of the vasoactive intestinal peptide (VIP) family that potentiates glucose-stimulated insulin secretion. Pancreatic beta cells express two PACAP receptor subtypes, a PACAP-preferring (PAC1) and a VIP-shared (VPAC2) receptor. We have applied a gene targeting approach to create a mouse lacking the PAC1 receptor (PAC1(-/-)). These mice were viable and normoglycemic, but exhibited a slight feeding hyperinsulinemia. In vitro, in the isolated perfused pancreas, the insulin secretory response to PACAP was reduced by 50% in PAC1(-/-) mice, whereas the response to VIP was unaffected. In vivo, the insulinotropic action of PACAP was also acutely reduced, and the peptide induced impairment of glucose tolerance after an intravenous glucose injection. This demonstrates that PAC1 receptor is involved in the insulinotropic action of the peptide. Moreover, PAC1(-/-) mice exhibited reduced glucose-stimulated insulin secretion in vitro and in vivo, showing that the PAC1 receptor is required to maintain normal insulin secretory responsiveness to glucose. The defective insulinotropic action of glucose was associated with marked glucose intolerance after both intravenous and gastric glucose administration. Thus, these results are consistent with a physiological role for the PAC1 receptor in glucose homeostasis, notably during food intake.
Figures
Similar articles
-
Pituitary adenylate cyclase-activating polypeptide receptors mediating insulin secretion in rodent pancreatic islets are coupled to adenylate cyclase but not to PLC.Endocrinology. 2002 Apr;143(4):1253-9. doi: 10.1210/endo.143.4.8739. Endocrinology. 2002. PMID: 11897681
-
Pituitary adenylate cyclase-activating polypeptide and PACAP receptor expression and function in the rat adrenal gland.Int J Mol Med. 2002 Mar;9(3):233-43. Int J Mol Med. 2002. PMID: 11836629
-
A cloned frog vasoactive intestinal polypeptide/pituitary adenylate cyclase-activating polypeptide receptor exhibits pharmacological and tissue distribution characteristics of both VPAC1 and VPAC2 receptors in mammals.Endocrinology. 1999 Mar;140(3):1285-93. doi: 10.1210/endo.140.3.6576. Endocrinology. 1999. PMID: 10067855
-
Perspectives on pituitary adenylate cyclase activating polypeptide (PACAP) in the neuroendocrine, endocrine, and nervous systems.Jpn J Physiol. 1998 Oct;48(5):301-31. doi: 10.2170/jjphysiol.48.301. Jpn J Physiol. 1998. PMID: 9852340 Review.
-
Pituitary adenylate cyclase-activating polypeptide and its receptors: from structure to functions.Pharmacol Rev. 2000 Jun;52(2):269-324. Pharmacol Rev. 2000. PMID: 10835102 Review.
Cited by
-
Altered psychomotor behaviors in mice lacking pituitary adenylate cyclase-activating polypeptide (PACAP).Proc Natl Acad Sci U S A. 2001 Nov 6;98(23):13355-60. doi: 10.1073/pnas.231094498. Epub 2001 Oct 30. Proc Natl Acad Sci U S A. 2001. PMID: 11687615 Free PMC article.
-
Pharmacology, physiology, and mechanisms of action of dipeptidyl peptidase-4 inhibitors.Endocr Rev. 2014 Dec;35(6):992-1019. doi: 10.1210/er.2014-1035. Epub 2014 Sep 12. Endocr Rev. 2014. PMID: 25216328 Free PMC article. Review.
-
Impairment of mossy fiber long-term potentiation and associative learning in pituitary adenylate cyclase activating polypeptide type I receptor-deficient mice.J Neurosci. 2001 Aug 1;21(15):5520-7. doi: 10.1523/JNEUROSCI.21-15-05520.2001. J Neurosci. 2001. PMID: 11466423 Free PMC article.
-
PACAP type I receptor transactivation is essential for IGF-1 receptor signalling and antiapoptotic activity in neurons.EMBO J. 2007 Mar 21;26(6):1542-51. doi: 10.1038/sj.emboj.7601608. Epub 2007 Mar 1. EMBO J. 2007. PMID: 17332755 Free PMC article.
-
PAC1 deficiency reduces chondrogenesis in atherosclerotic lesions of hypercholesterolemic ApoE-deficient mice.BMC Cardiovasc Disord. 2023 Nov 18;23(1):566. doi: 10.1186/s12872-023-03600-5. BMC Cardiovasc Disord. 2023. PMID: 37980508 Free PMC article.
References
-
- Henquin, J.C. 1994. Cell biology of insulin secretion. In Joslin’s diabetes mellitus. 13th edition. C.R. Kahn, and G.C. Weir, editors. Lea & Febiger. Philadelphia, Pennsylvania, USA. 56–80.
-
- Schebalin M, Said SI, Makhlouf GM. Stimulation of insulin and glucagon secretion by vasoactive intestinal peptide. Am J Physiol. 1977;232:E197–E200. - PubMed
-
- Ahren B. Glucagon-like peptide-1 (GLP-1): a gut hormone of potential interest in the treatment of diabetes. Bioessays. 1998;20:642–651. - PubMed
-
- Miyata A, et al. Isolation of a novel 38 residue-hypothalamic polypeptide which stimulates adenylate cyclase in pituitary cells. Biochem Biophys Res Commun. 1989;164:567–574. - PubMed
Publication types
MeSH terms
Substances
LinkOut - more resources
Full Text Sources
Other Literature Sources
Medical
Molecular Biology Databases
