. 2000 May 9;97(10):5498-503.
doi: 10.1073/pnas.040566697.

Critical contribution of liver natural killer T cells to a murine model of hepatitis

Affiliations

Critical contribution of liver natural killer T cells to a murine model of hepatitis

K Takeda et al. Proc Natl Acad Sci U S A. .

Abstract

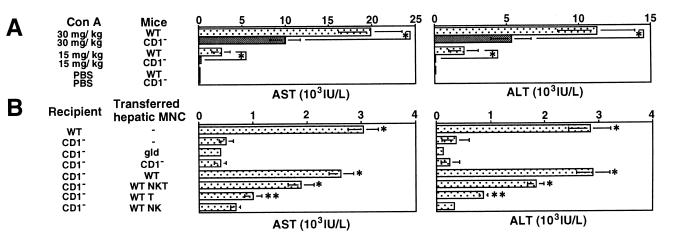
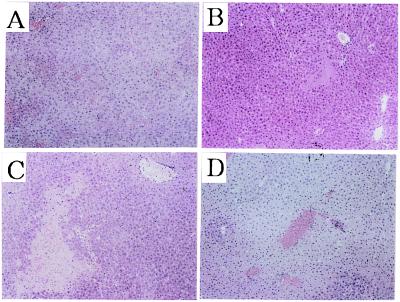
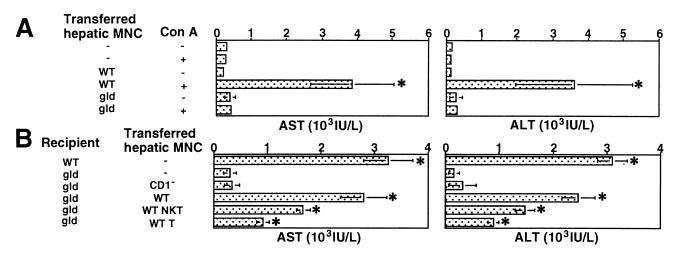
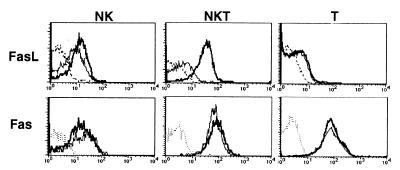
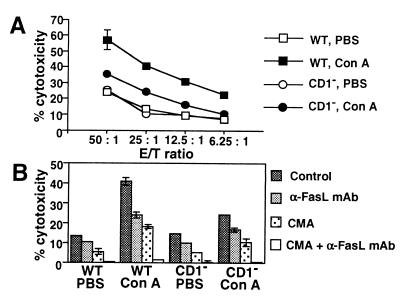
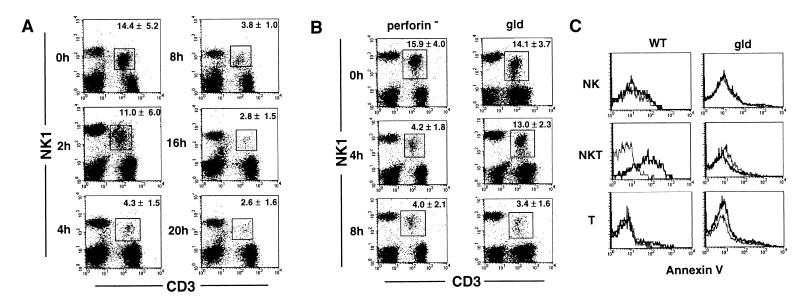
Natural killer T (NKT) cells constitute a distinct subpopulation of T cells with a unique antigen specificity, prompt effector functions, and an unusual tissue distribution. NKT cells are especially abundant in the liver, but their physiological function in this organ remains unclear. In the present study, we examined the possible contribution of NKT cells to a murine model of hepatitis induced by i.v. injection of Con A. CD1-deficient mice lacking NKT cells were highly resistant to Con A-induced hepatitis. Adoptive transfer of hepatic NKT cells isolated from wild-type mice, but not from FasL-deficient gld mice, sensitized CD1-deficient mice to Con A-induced hepatitis. Furthermore, adoptive transfer of hepatic mononuclear cells from wild-type mice, but not from CD1-deficient mice, sensitized gld mice to Con A-induced hepatitis. Upon Con A administration, hepatic NKT cells rapidly up-regulated cell surface FasL expression and FasL-mediated cytotoxicity. At the same time, NKT cells underwent apoptosis leading to their rapid disappearance in the liver. These results implicated FasL expression on liver NKT cells in the pathogenesis of Con A-induced hepatitis, suggesting a similar pathogenic role in human liver diseases such as autoimmune hepatitis.


Figures

Figure 1
Figure 1
Critical contribution of NKT cells to Con A-induced hepatitis. (A) Impairment of Con A-induced hepatitis in CD1-deficient mice. Wild-type B6 mice (WT) and CD1-deficient B6 mice (CD1) were i.v. injected with 30 mg/kg or 15 mg/kg Con A or with PBS only. Sera from individual mice were obtained 20 h later, and AST and ALT levels were measured. Data are presented as mean ± SD of 10 mice in each group. Similar results were obtained in three independent experiments. *, P < 0.01. (B) Adoptive transfer of hepatic NKT cells isolated from wild-type (WT) mice sensitizes CD1-deficient (CD1) mice to Con A-induced hepatitis. As control, 15 mg/kg Con A was injected into the liver of WT or CD1 mice without adoptive transfer of hepatic MNCs. The other groups of CD1 mice were injected with 15 mg/kg Con A along with total hepatic MNCs (5 × 10⁶ cells) isolated from the indicated mice or the indicated hepatic MNC subpopulation (2 × 10⁶ cells) isolated from WT mice. Sera from individual mice were obtained 6 h later, and AST and ALT levels were measured. Data are shown as the mean ± SD of 10 mice in each group. Similar results were obtained in three independent experiments. *, P < 0.01 and **, P < 0.05 as compared with Con A-injected CD1 mice.
Figure 2
Figure 2
Histological examination of the Con A- and NKT-induced hepatitis in CD1-deficient mice. The livers were removed from i.v. Con A-injected wild-type mice 20 h later (A), intrahepatic Con A-injected CD1-deficient mice (B), intrahepatic Con A- and CD1-deficient hepatic MNC-injected CD1-deficient mice (C), and intrahepatic Con A and wild-type NKT cells-injected CD1-deficient mice (D) 6 h later. Paraffin sections were stained with hematoxylin/eosin. (Original magnifications: ×200.)
Figure 3
Figure 3
Critical contribution of FasL on NKT cells for Con A-induced hepatitis. (A) Adoptive transfer of hepatic MNC isolated from wild-type (WT) mice sensitizes gld mice to Con A-induced hepatitis. Total hepatic MNCs (5 × 10⁶ cells) isolated from the indicated mice and/or 15 mg/kg Con A were injected into the liver of gld mice. Sera from individual mice were obtained 6 h after injection, and AST and ALT levels were measured. Data are shown as the mean ± SD of 10 mice in each group. Similar results were obtained in three independent experiments. *, P < 0.01 compared with Con A-injected gld mice. (B) Adoptive transfer of hepatic MNC from CD1-deficient (CD1) mice does not sensitize gld mice to Con A-induced hepatitis. Total hepatic MNCs (5 × 10⁶ cells) isolated from the indicated mice or the indicated hepatic MNC subpopulation (2 × 10⁶ cells) isolated from wild-type (WT) mice were injected into the liver of gld mice along with 15 mg/kg Con A. Sera from individual mice were obtained 6 h later, and AST and ALT levels were measured. Data are shown as the mean ± SD of 10 mice in each group. Similar results were obtained in three independent experiments. *, P < 0.01 compared with Con A-injected gld mice.
Figure 4
Figure 4
Expression of FasL and Fas on hepatic MNC subpopulations with or without Con A injection. Wild-type B6 mice were i.v. injected with 15 mg/kg Con A or PBS only. Hepatic MNC were isolated 2 h later, and then stained with biotinylated anti-FasL mAb or anti-Fas mAb followed by FITC-conjugated anti-mouse NK1.1 mAb, Cy-chrome-conjugated anti-CD3 mAb, and PE-conjugated streptavidin. Expression of FasL or Fas was analyzed on electronically gated NK1.1+CD3 (NK), NK1.1+CD3+ (NKT), or NK1.1CD3+ (T) cells. Bold lines indicate the staining of Con A-injected hepatic MNCs, thin lines indicate the staining of PBS-injected hepatic MNCs, and broken lines indicate the background staining with isotype-matched control IgG. Similar results were obtained in three independent experiments.
Figure 5
Figure 5
FasL-mediated cytotoxic activity of hepatic NKT cells after Con A injection. (A) Impairment of Con A-induced cytotoxicity in CD1-deficient (CD1) mice. Wild-type (WT) and CD1 mice were i.v. injected with 15 mg/kg of Con A or PBS only. Hepatic MNCs were isolated 2 h later, and their cytotoxic activity was tested against WR/F target cells by 4 h 51Cr release assay at the indicated effector-to-target (E/T) ratios. Data are represented as the mean ± SD of triplicate wells. Similar results were obtained in three independent experiments. (B) FasL- and perforin-mediated cytotoxicity induced by Con A injection. Hepatic MNCa were prepared as described above, and the cytotoxicity against WR/F was tested in the presence or absence of α-FasL mAb (10 μg/ml) and/or CMA (50 nM) at an effector-to-target ratio of 25. Data are represented as the mean ± SD of triplicate wells. Similar results were obtained in three independent experiments.
Figure 6
Figure 6
Apoptotic elimination of hepatic NKT cells after Con A injection. (A) Selective depletion of hepatic NKT cells upon administration of Con A. Wild-type B6 mice were i.v. injected with 15 mg/kg Con A. After the indicated period, hepatic MNCs were isolated and stained with FITC-conjugated anti-CD3 mAb and PE-conjugated anti-NK1.1 mAb. The percentage of NKT cells (boxed) indicated in each panel represents mean ± SD of five mice at each time point. Similar results were obtained in three independent experiments. (B) Delayed depletion of hepatic NKT cells in gld mice. Perforin-deficient mice and gld mice were i.v. injected with 15 mg/kg of Con A. After the indicated period, hepatic MNCs were isolated and stained with FITC-conjugated anti-CD3 mAb and PE-conjugated anti-NK1.1 mAb. The percentage of NKT cells (boxed) indicated in each panel represents the mean ± SD of five mice at each time point. Similar results were obtained in two independent experiments. (C) FasL-mediated apoptosis of hepatic NKT cells. Wild-type (WT) and gld mice were i.v. injected with 15 mg/kg Con A or PBS only. Hepatic MNC were isolated 2 h later and stained with PE-conjugated anti-NK1.1 mAb and Cy-chrome-conjugated anti-CD3 mAb. Then, annexin V binding assay was performed by using annexin V-FITC apoptosis detection kit. Annexin V binding was analyzed on electronically gated NK1.1+CD3 (NK), NK1.1+CD3+ (NKT), or NK1.1CD3+ (T) cells. Bold lines indicate the annexin V binding to Con A-injected hepatic MNCs, and thin lines indicate the annexin V binding to PBS-injected hepatic MNCs. Similar results were obtained in two independent experiments.

References

    1. Bendelac A, Rivera M N, Park S H, Roark J H. Annu Rev Immunol. 1997;15:535–562. - PubMed
    1. MacDonald H R. J Exp Med. 1995;182:633–638. - PMC - PubMed
    1. Vicari A P, Zlotnik A. Immunol Today. 1996;17:71–76. - PubMed
    1. Castano A R, Tangri S, Miller J E, Holcombe H R, Jackson M R, Huse W D, Kronenberg M, Peterson P A. Science. 1995;269:223–226. - PubMed
    1. Kawano T, Cui J, Koezuka Y, Toura I, Kaneko Y, Motoki K, Ueno H, Nakagawa R, Sato H, Kondo E. Science. 1997;278:1626–1629. - PubMed

Publication types

MeSH terms

LinkOut - more resources