

Within- and between-subject variations in pharmacokinetic parameters of ethanol by analysis of breath, venous blood and urine
- PMID: 10792196
- PMCID: PMC2014954
- DOI: 10.1046/j.1365-2125.2000.00194.x
Within- and between-subject variations in pharmacokinetic parameters of ethanol by analysis of breath, venous blood and urine
Abstract
Aims: To evaluate the prerequisites for using ethanol dilution to estimate total body water, we studied the within- and between-subject variation in the parameter estimates of a two-compartment model for ethanol pharmacokinetics with parallel Michaelis-Menten and first-order renal elimination. Because sampling of breath might be preferable in some clinical situations the parameter estimates derived from breath and venous blood were compared.
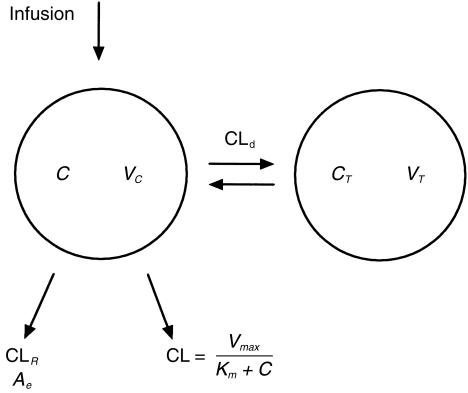
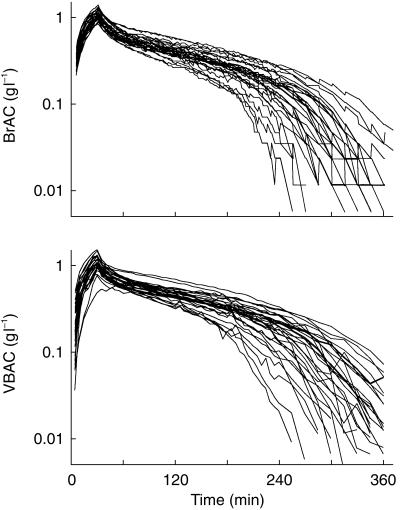
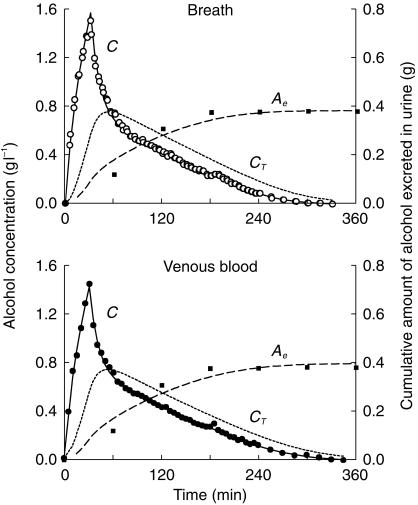
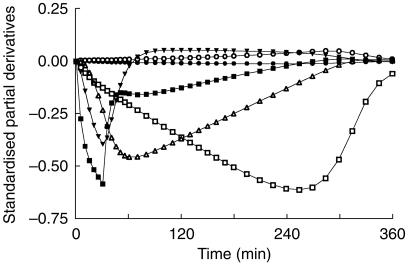
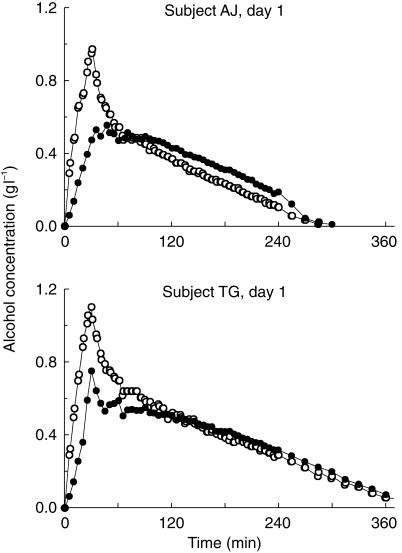
Methods: On two occasions, ethanol 0.4 g kg-1 was given by intravenous infusion to 16 volunteers after they had fasted overnight. The proposed model was fitted by means of nonlinear regression to concentration-time data measured in the breath, venous blood and urine during 360 min. The model contained six parameters: Vmax and Km (Michaelis-Menten elimination constants), CLd (intercompartmental distribution parameter), VC and VT (volumes of the central and tissue compartment, respectively) and CLR (renal clearance). The volume of distribution, Vss, was calculated as the sum of VC and VT.
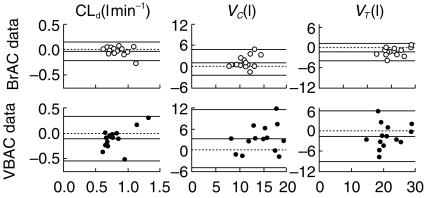
Results: The mean +/- total s.d. of the parameter estimates derived from blood data were Vmax 95 +/- 25 mg min-1, Km 27 +/- 19 mg l-1, CLd 809 +/- 232 ml min-1, VC 14.5 +/- 4.3 l, VT 21. 2 +/- 4.4 l, CLR 3.6 +/- 2.0 ml min-1 and Vss 35.8 +/- 4.3 l. The variation within subjects amounted to 3%, 9%, 21%, 21%, 17%, 26% and 2%, respectively, of the total variation. Breath samples were associated with a similar or lower variation than blood, both within and between subjects. About 1.5% of the infused ethanol was recovered in the urine.
Conclusions: The low within-subject variation of the key parameter Vss (only 2%) suggests that ethanol dilution analysed by the pharmacokinetic model applied here may be used as an index of the total body water. Breath samples yielded at least as good reproducibility in the model parameters as venous blood.
Figures
References
-
- Holford NHG. Clinical pharmacokinetics of ethanol. Clin Pharmacokin. 1987;13:273–292. - PubMed
-
- Kalant H. Pharmacokinetics of ethanol: absorption, distribution, and elimination. In: Begleiter H, Kissin B, editors. The pharmacology of alcohol and alcohol dependence. New York – Oxford: Oxford University Press; 1996. pp. 15–58.
-
- Widmark EMP. Berlin: Urban und Schwarzenberg; 1932. Die theoretischen Grundlagen und die praktische Verwendbarkeit der gerichtlich-medizinischen Alkoholbestimmung; pp. 1–140.
-
- Lundquist F, Wolthers H. The kinetics of alcohol elimination in man. Acta Pharmacol Toxicol. 1958;14:265–289. - PubMed
-
- Wilkinson PK, Sedman AJ, Sakmar E, Earhart RH, Weidler DJ, Wagner JG. Blood ethanol concentrations during and following constant-rate intravenous infusion of alcohol. Clin Pharmacol Ther. 1976;19:213–223. - PubMed
Publication types
MeSH terms
Substances
LinkOut - more resources
Full Text Sources
Other Literature Sources
Miscellaneous
