

Ca(2+) entry through store-operated channels in mouse sperm is initiated by egg ZP3 and drives the acrosome reaction
- PMID: 10793136
- PMCID: PMC14868
- DOI: 10.1091/mbc.11.5.1571
Ca(2+) entry through store-operated channels in mouse sperm is initiated by egg ZP3 and drives the acrosome reaction
Abstract
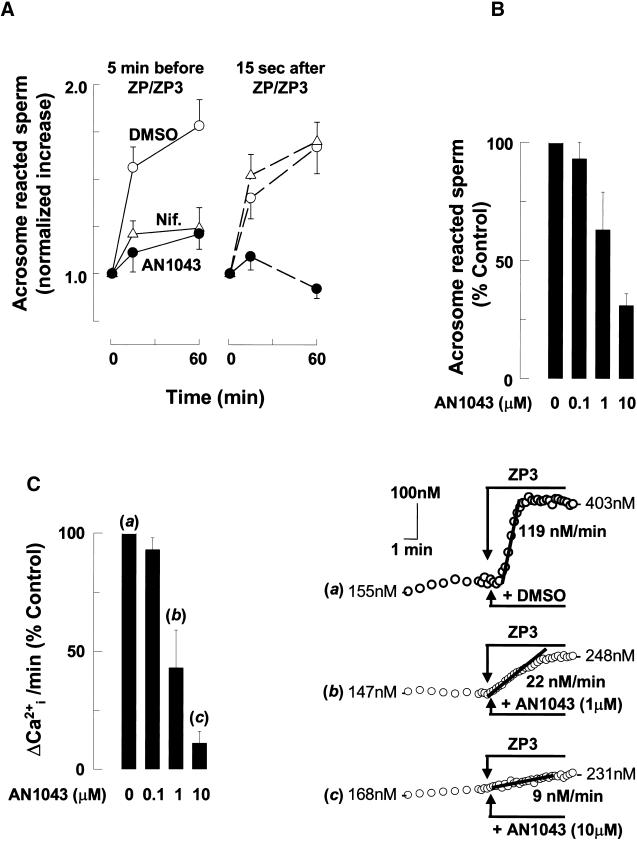
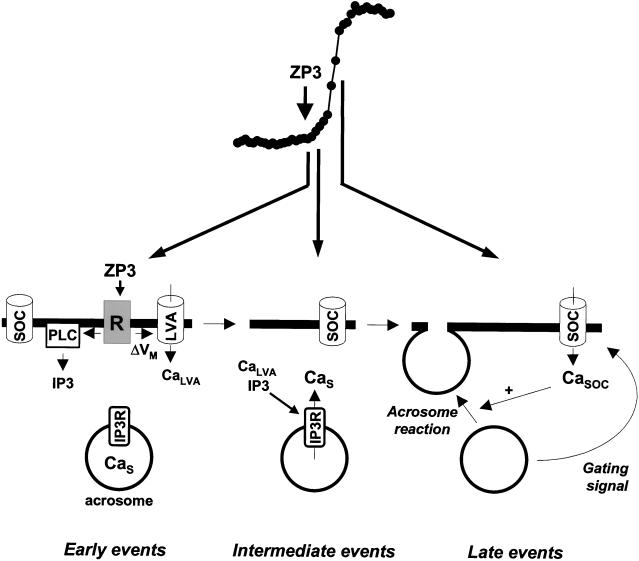
Fertilization occurs after the completion of the sperm acrosome reaction, a secretory event that is triggered during gamete adhesion. ZP3, an egg zona pellucida glycoprotein, produces a sustained increase of the internal Ca(2+) concentration in mouse sperm, leading to acrosome reactions. Here we show that the sustained Ca(2+) concentration increase is due to the persistent activation of a Ca(2+) influx mechanism during the late stages of ZP3 signal transduction. These cells also possess a Ca(2+) store depletion-activated Ca(2+) entry pathway that is open after treatment with thapsigargin. Thapsigargin and ZP3 activate the same Ca(2+) permeation mechanism, as demonstrated by fluorescence quenching experiments and by channel antagonists. These studies show that ZP3 generates a sustained Ca(2+) influx through a store depletion-operated pathway and that this drives the exocytotic acrosome reaction.
Figures
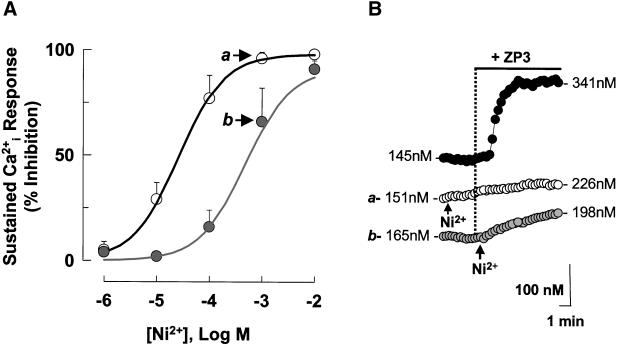
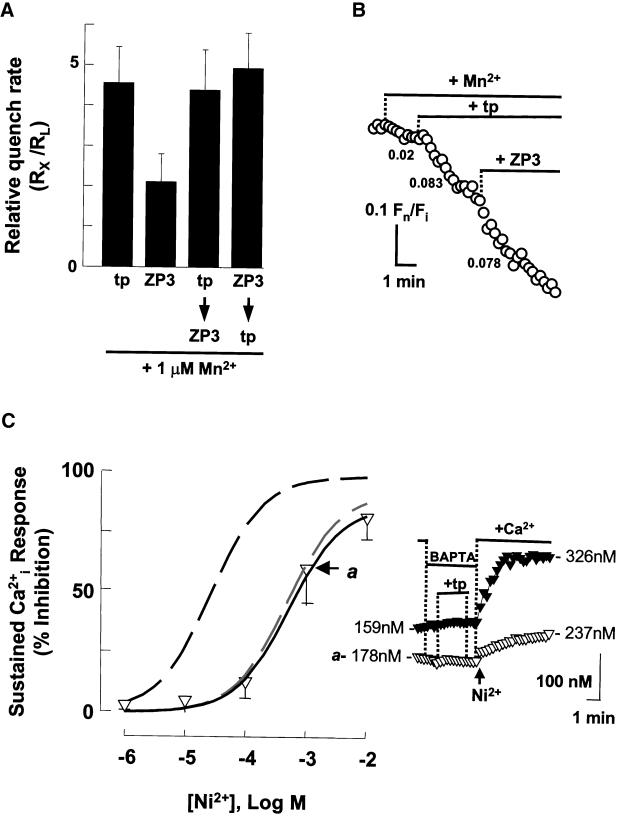
 ). Response
rates (ΔCa2+i/Δt) were determined as
described (Figure 1). (A) Data are means ± SD of observations on
7–22 cells and are fit to the expression I = (100 ×
IC50)/(IC50 + C), where I is the inhibition of
response rates in the presence Ni2+ and C and
IC50 are the specific Ni2+ concentration and
the concentration that inhibits Ca2+i response
by 50%, respectively. Calculated values of IC50 were 26
μM for Ni2+ before ZP3 (black line) and 481 μM for
Ni2+ after ZP3 (gray line). Letters (a and b) designate
points that are illustrated by traces in B. (B) Montage of traces
showing sperm treatment with 10 μg/ml ZP3 (●), with 1 mM
Ni2+ added 15 s after ZP3 (), or with
Ni2+ added 2 min before ZP3 (○).
). Response
rates (ΔCa2+i/Δt) were determined as
described (Figure 1). (A) Data are means ± SD of observations on
7–22 cells and are fit to the expression I = (100 ×
IC50)/(IC50 + C), where I is the inhibition of
response rates in the presence Ni2+ and C and
IC50 are the specific Ni2+ concentration and
the concentration that inhibits Ca2+i response
by 50%, respectively. Calculated values of IC50 were 26
μM for Ni2+ before ZP3 (black line) and 481 μM for
Ni2+ after ZP3 (gray line). Letters (a and b) designate
points that are illustrated by traces in B. (B) Montage of traces
showing sperm treatment with 10 μg/ml ZP3 (●), with 1 mM
Ni2+ added 15 s after ZP3 (), or with
Ni2+ added 2 min before ZP3 (○).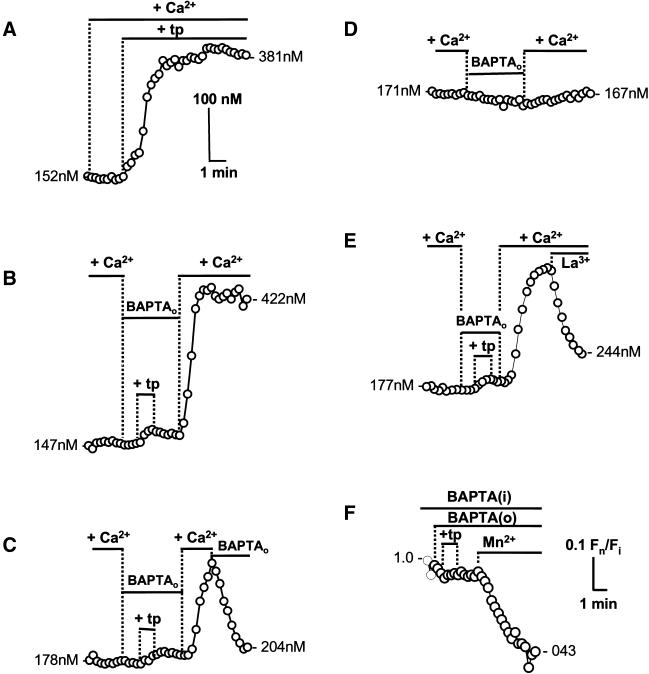
References
-
- Arnoult C, Villaz M, Florman HM. Pharmacological properties of the T-type calcium current of mouse spermatogenic cells. Mol Pharmacol. 1998;53:1104–1111. - PubMed
Publication types
MeSH terms
Substances
Grants and funding
LinkOut - more resources
Full Text Sources
Other Literature Sources
Molecular Biology Databases
Miscellaneous
