Comparative Study
. 2000 May;11(5):1645-55.
doi: 10.1091/mbc.11.5.1645.

High-resolution FRET microscopy of cholera toxin B-subunit and GPI-anchored proteins in cell plasma membranes

Affiliations
Free PMC article
Comparative Study

High-resolution FRET microscopy of cholera toxin B-subunit and GPI-anchored proteins in cell plasma membranes

A K Kenworthy et al. Mol Biol Cell. 2000 May.
Free PMC article

Abstract

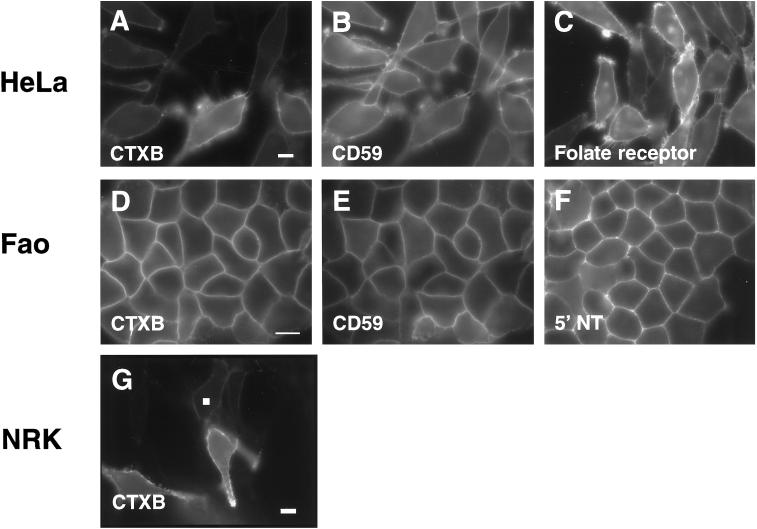
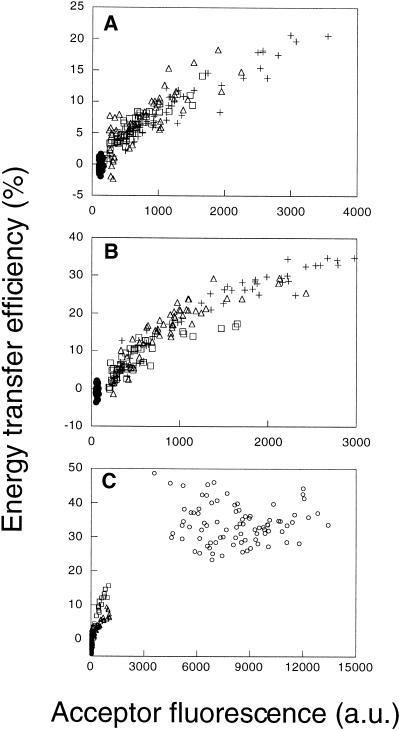
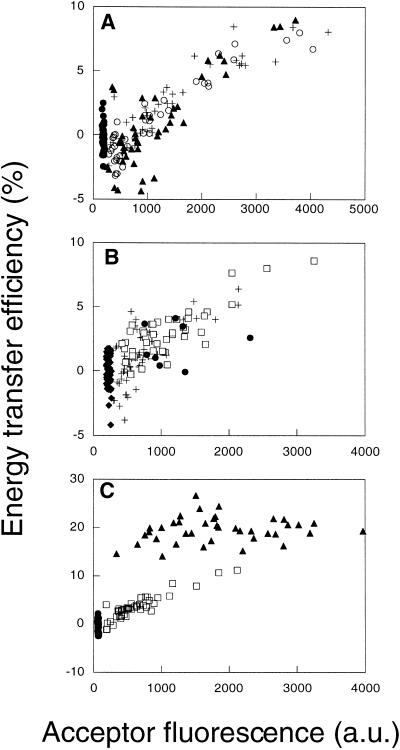
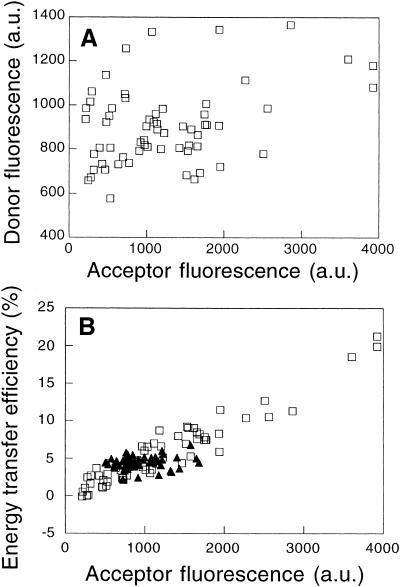
"Lipid rafts" enriched in glycosphingolipids (GSL), GPI-anchored proteins, and cholesterol have been proposed as functional microdomains in cell membranes. However, evidence supporting their existence has been indirect and controversial. In the past year, two studies used fluorescence resonance energy transfer (FRET) microscopy to probe for the presence of lipid rafts; rafts here would be defined as membrane domains containing clustered GPI-anchored proteins at the cell surface. The results of these studies, each based on a single protein, gave conflicting views of rafts. To address the source of this discrepancy, we have now used FRET to study three different GPI-anchored proteins and a GSL endogenous to several different cell types. FRET was detected between molecules of the GSL GM1 labeled with cholera toxin B-subunit and between antibody-labeled GPI-anchored proteins, showing these raft markers are in submicrometer proximity in the plasma membrane. However, in most cases FRET correlated with the surface density of the lipid raft marker, a result inconsistent with significant clustering in microdomains. We conclude that in the plasma membrane, lipid rafts either exist only as transiently stabilized structures or, if stable, comprise at most a minor fraction of the cell surface.


Figures

Figure 1
Figure 1
Models for the organization of GSL and GPI-anchored proteins in lipid rafts at the cell surface. ▪, GSL; ○, GPI-anchored proteins. (A) Coclustering model. Lipid rafts are microdomains large enough to contain tens to hundreds of GSL and GPI-anchored proteins. They may be stabilized by specific proteins such as caveolin. (B) Differential clustering model. Proteins and lipids associate with rafts to extents that depend on their affinities for lipid microdomains of a given composition and physical state. In both A and B, the total protein or GSL content of the membrane could affect E between labeled components of the rafts. High levels of GSL might enhance clustering of GPI-anchored proteins in lipid rafts. Alternatively, GPI-anchored proteins, and perhaps GSL, may compete for limited amounts of raft-forming lipids such as cholesterol. (C) Unstable or very small raft model. Mobile lipids and proteins found in biochemically isolated lipid raft fractions are normally dispersed at random, although their interaction with lipids may show some specificity. Cross-linking or other perturbations aggregate the complexes and stabilize them. Variations of these models have been described previously (Harder and Simons, 1997; Simons and Ikonen, 1997; Brown and London, 1998; Jacobson and Dietrich, 1999). See the text for details of how FRET microscopy measurements can discriminate between these models.
Figure 2
Figure 2
Cell surface expression of GM1 and of endogenous GPI-anchored proteins visualized by fluorescence microscopy. GM1 was detected with Cy3- or Cy5-labeled CTXB (A, D, and G), and labeled monoclonal antibodies were used to detect human CD59 (B), human folate receptor (C), rat CD59 (E), or rat 5′ NT (F) in HeLa (A–C), Fao (D–F), and NRK (G) cells. Exposure times were optimized to maximize the signal for each marker, so their relative fluorescence intensities are not directly comparable. Note however that the levels of surface expression varied significantly from cell to cell for some of the markers (A, C, and G) and that the expression of the various markers was not correlated in double-labeled cells (compare A with B and D with E). The white box in G corresponds to a typical roi sampled to obtain the data presented below (see Figures 3–6) for NRK and HeLa cells. For Fao cells, smaller rois centered on the lines of plasma membrane label were used (not visible in this figure). Bars: A—C, D—F, and G, 10 μm.
Figure 3
Figure 3
Energy transfer efficiencies between donor- and acceptor-labeled CTXB are dependent on their surface density in the plasma membrane of several cell types. (A and B) E measured between labeled CTXB in HeLa (A) and NRK (B) cells for D:A ratios of 1:1 (□), 1:2 (▵), and 1:3 (+). Control samples were labeled with Cy3-labeled CTXB only (●). Each data point in these plots is taken from a single cell, sampled from an roi as defined in Figure 2. Note that in this figure the absolute fluorescence intensities in A and B are comparable. (C) Comparison of FRET for CTXB in HeLa (▵), NRK (□), and Fao (○) cells. The mean E for CTXB in Fao cells ranged from 20 to 40% (n = 7 independent experiments) but was always significantly higher than that measured in NRK or HeLa cells in the same experiment. a.u., arbitrary units.
Figure 4
Figure 4
Energy transfer efficiencies between donor- and acceptor-labeled anti-folate receptor antibodies are dependent on their density in HeLa cell plasma membranes. (A) E measured between the labeled anti-folate receptor IgG MOv19 for D:A ratios of 1:1 (○), 1:2 (+), and 1:3 (▴). Control samples were labeled with Cy3-labeled probe only (●). (B) E measured between the labeled anti-folate receptor IgG MOv19 (□) and MOv18 (+) at a D:A of 1:1. Control samples include fixed cells labeled with Cy3-MOv18 only (♦) and live cells labeled with MOv18 at a D:A of 1:1 (●). (C) A positive control demonstrating the detection of clustering between directly bound molecules. E measured between Cy3- and Cy5-labeled MOv19 (□) is density dependent, whereas E between Cy3-labeled MOv19 and Cy5 donkey anti-mouse IgG (▴) is independent of surface density and is significant (E ∼ 20%) even at low acceptor surface densities. Negative control samples were labeled with Cy3-labeled probe only (●).
Figure 5
Figure 5
Energy transfer efficiencies correlate with the surface densities of endogenous GPI-anchored proteins and CTXB in HeLa and Fao cells. (A) Comparison of E for CTXB (+), CD59 (▴), and folate receptor (○) in HeLa cells. (B) Comparison of E for CTXB (○), 5′ NT (□), and CD59 (▴) in Fao cells.
Figure 6
Figure 6
Energy transfer between a GPI-anchored protein and a GSL is consistent with their being randomly distributed with respect to one another. (A) Plot demonstrating the lack of correlation between the surface expression of CD59 and CTXB binding in individual HeLa cells. Each symbol shows the fluorescence intensity of Cy3-anti-CD59 IgG and Cy5-CTXB for a single cell. (B) FRET measured between Cy3-anti-CD59 IgG and Cy5-CTXB (□) or Cy3-CTXB and Cy5-anti-CD59 IgG (▴) in HeLa cells. Because of the cell-to-cell variation in the surface densities of CTXB and CD59 on individual HeLa cells (A), D:A varied >15-fold in this experiment.

References

    1. Anderson RGW. The caveolae membrane system. Annu Rev Biochem. 1998;67:199–225. - PubMed
    1. Antony AC. The biological chemistry of folate receptors. Blood. 1992;79:2807–2820. - PubMed
    1. Bastiaens PI, Jovin TM. Microspectroscopic imaging tracks the intracellular processing of a signal transduction protein: fluorescent-labeled protein kinase C beta I. Proc Natl Acad Sci USA. 1996;93:8407–8412. - PMC - PubMed
    1. Blackman SM, Piston DW, Beth AH. Oligomeric state of human erythrocyte band 3 measured by fluorescence resonance energy homotransfer. Biophys J. 1998;75:1117–1130. - PMC - PubMed
    1. Brown DA, London E. Functions of lipid rafts in biological membranes. Annu Rev Cell Dev Biol. 1998;14:111–136. - PubMed

Publication types

LinkOut - more resources