. 2000 May;43(5):716-25.
doi: 10.1002/(sici)1522-2594(200005)43:5<716::aid-mrm14>3.0.co;2-k.

An analytical SMASH procedure (ASP) for sensitivity-encoded MRI

Affiliations

An analytical SMASH procedure (ASP) for sensitivity-encoded MRI

R F Lee et al. Magn Reson Med. 2000 May.

Abstract

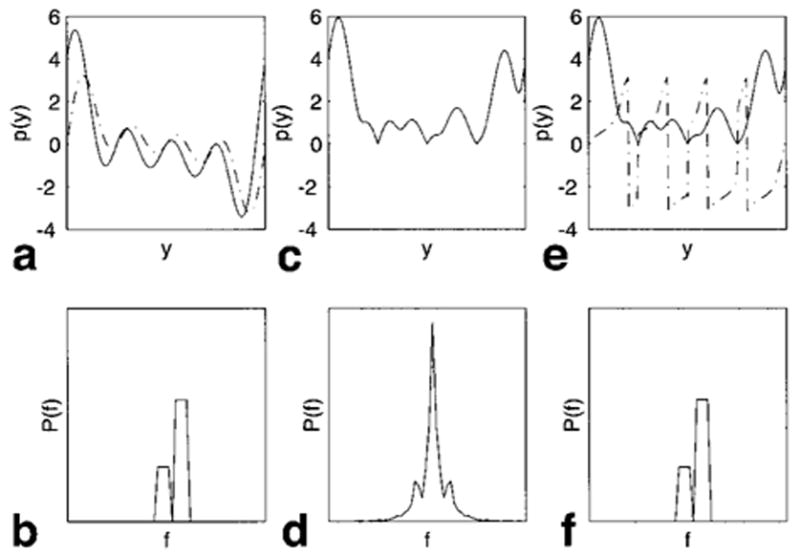
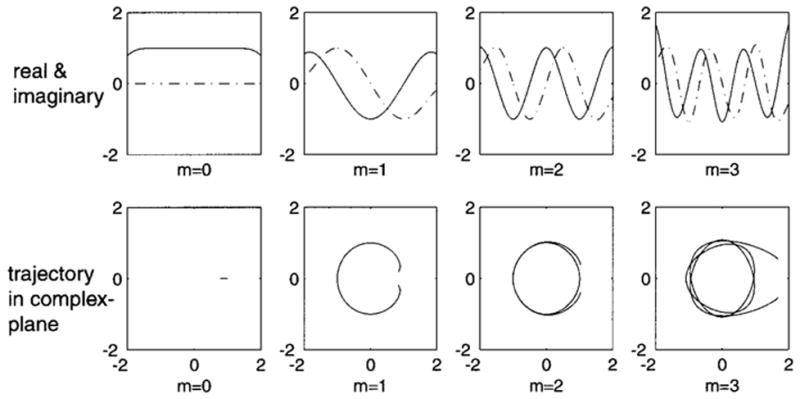
The simultaneous acquisition of spatial harmonics (SMASH) method of imaging with detector arrays can reduce the number of phase-encoding steps, and MRI scan time several-fold. The original approach utilized numerical gradient-descent fitting with the coil sensitivity profiles to create a set of composite spatial harmonics to replace the phase-encoding steps. Here, an analytical approach for generating the harmonics is presented. A transform is derived to project the harmonics onto a set of sensitivity profiles. A sequence of Fourier, Hilbert, and inverse Fourier transform is then applied to analytically eliminate spatially dependent phase errors from the different coils while fully preserving the spatial-encoding. By combining the transform and phase correction, the original numerical image reconstruction method can be replaced by an analytical SMASH procedure (ASP). The approach also allows simulation of SMASH imaging, revealing a criterion for the ratio of the detector sensitivity profile width to the detector spacing that produces optimal harmonic generation. When detector geometry is suboptimal, a group of quasi-harmonics arises, which can be corrected and restored to pure harmonics. The simulation also reveals high-order harmonic modulation effects, and a demodulation procedure is presented that enables application of ASP to a large numbers of detectors. The method is demonstrated on a phantom and humans using a standard 4-channel phased-array MRI system.


Figures

FIG. 1
FIG. 1
Demonstration of the FT-HT method of phase recovery on a 1D image from 2 bottles, one with twice the signal of the other, which can be formed from the sum of four sinusoids. a is the original analytical signal, p(y) (solid line, real; dashed line, imaginary). b is the projection, P(f), which is the FT of p(t). c is the magnitude of the original signal, ∣p(y)∣, d is the FT of ∣p(y)∣, showing distortion and loss of the image information compared with b. e is the minimum phase signal recovered from the magnitude ∣p(y)∣ of c via HT (solid line, magnitude; dashed line, phase). f is the FT of this recovered signal, demonstrating full restoration of the image information from d, as compared to b. The horizontal axes are space (y) or spatial frequency (f). Vertical axes are in arbitrary units.
FIG. 2
FIG. 2
Demonstration of the harmonic generation and the essential role of phase correction in the harmonic generation. a, b, c, and d are the images from four coils, the data along the central horizontal lines in the images are used to demonstrate the harmonic generation and phase correction in plots ep. Plots eh are the original Re and Im parts of the profiles without phase correction, and i and j are the Re and Im parts of the harmonics generated therefrom. Plot i is the zero-order harmonic, and j is the first-order harmonic. Both exhibit serious distortions of the composite harmonics due to the phase incoherence. Plots kn are the Re and Im parts of the profiles after phase correction with the FT-HT method. Plots o and p are the Re and Im parts of the harmonics generated from kn. Plot o is the zero-order harmonic, and p is the first-order harmonic. The harmonic character of o and p is obvious. The horizontal axes are y, and for plots, the vertical axes is image intensity in arbitrary units.
FIG. 3
FIG. 3
The kx dependency of 1/F(ky[m=0]), (a), and 1/F(ky[m=1]), (b), for data from a 28 cm diameter circular phantom using a phased-array. The vertical axes are in arbitrary units.
FIG. 4
FIG. 4
a, b, c, and d are the coronal MR images of human legs from four receive channels with decimated gradient phase-encoding steps. The FOV is 40 cm, TR is 18 msec, data acquisition matrix is 256 × 128, slice thickness is 5 mm. e is the hybrid ASP image reconstructed from raw data of images a, b, c, and d. The distortion and signal loss at the extreme edges of the scan plane are due to the non-linearity in the MRI gradients, and not the ASP encoding.
FIG. 5
FIG. 5
Illustration of concave distortion of composite harmonics with s/d = 0.5 and 9 detector coils. The top row is the real (Re, solid line) and imaginary (Im, dash line) parts of the composite harmonics. The horizontal axes is y, and the vertical axes are in arbitrary units. The second row shows the trajectories of the composite harmonics in the complex-plane. The horizontal axes are the Re part, and the vertical axes are the Im part. m is the harmonic order.
FIG. 6
FIG. 6
Illustration of convex distortion of composite harmonics with s/d = 2, 9 detector coils. The harmonic order is m. The top row shows the real (Re, solid line) and imaginary (Im, dash line) parts of the composite harmonics. The horizontal axes is y, and the vertical axes are in arbitrary units. The second row shows the trajectories of the composite harmonics in the complex-plane. The horizontal axes are the Re part, and the vertical axes are the Im part. When m = 0, 1, 2, these are quasi-harmonics. When m = 3, the composite signals are no longer harmonic.
FIG. 7
FIG. 7
Illustration of optimal composite harmonic generation with s/d = 1, 9 detector coils. The harmonic order is m. The top row shows the real (Re, solid line) and imaginary (Im, dash line) parts of the composite harmonics. The horizontal axes is y, and the vertical axes are in arbitrary units. The second row shows the trajectories of the composite harmonics in the complex-plane. The horizontal axes are the Re part, and the vertical axes are the Im part.
FIG. 8
FIG. 8
The composite harmonics of order m, for high order harmonic modulation and demodulation with 33 detector coils. Rows one, three, and five are real (Re, solid line) and imaginary (Im, dash lines) parts of the harmonics plotted with horizontal axes, y, and vertical axes in arbitrary units. Rows two, four, and six are the corresponding harmonic trajectories in the complex-plane plotted with horizontal axes as the Re part, and Im part on the vertical axes. The last pair of traces with m = 15 shows the results of the demodulation of the penultimate pair with m = 15.

References

    1. Roemer PB, Edelstein WA, Hayes CE, Souza SP, Mueller OM. The NMR phased array. Magn Reson Med. 1990;16:192–225. - PubMed
    1. Wright SM, Magin RI, Kelton JR. Arrays of mutually coupled receiver coils: theory and application. Magn Reson Med. 1991;17:252–268. - PubMed
    1. Bottomley PA, Olivieri CHL, Giaquinto R. What is the optimum phased array coil design for cardiac and torso magnetic resonance? Magn Reson Med. 1997;37:591–599. - PubMed
    1. Hutchinson M, Raff U. Fast MRI data acquisition using multiple detectors. Magn Reson Med. 1988;6:87–91. - PubMed
    1. Kwiat D, Einav S, Navon F. A decoupled coil detector array for fast image acquisition in magnetic resonance imaging. Med Phys. 1991;18:251–265. - PubMed

Publication types