. 2000 May 15;20(10):3571-9.
doi: 10.1523/JNEUROSCI.20-10-03571.2000.

Pregnenolone sulfate modulates inhibitory synaptic transmission by enhancing GABA(A) receptor desensitization

Affiliations

Pregnenolone sulfate modulates inhibitory synaptic transmission by enhancing GABA(A) receptor desensitization

W Shen et al. J Neurosci. .

Abstract

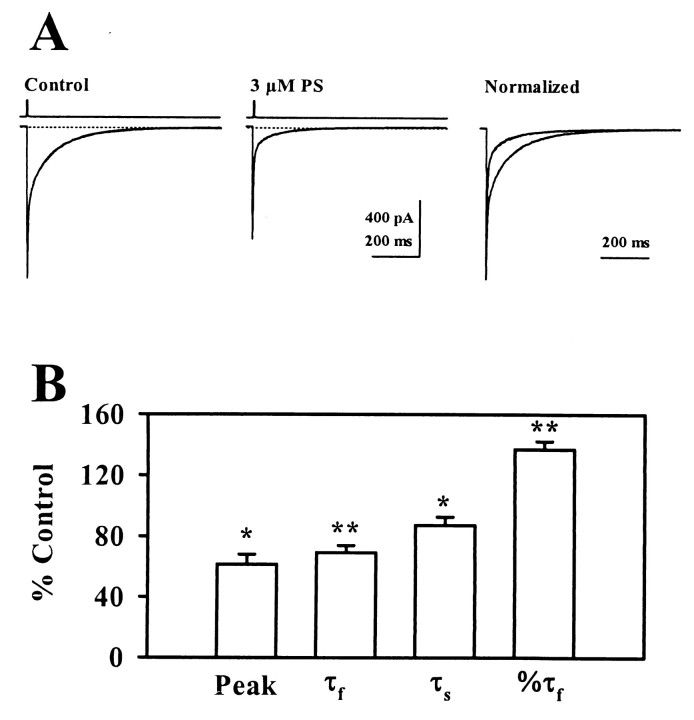
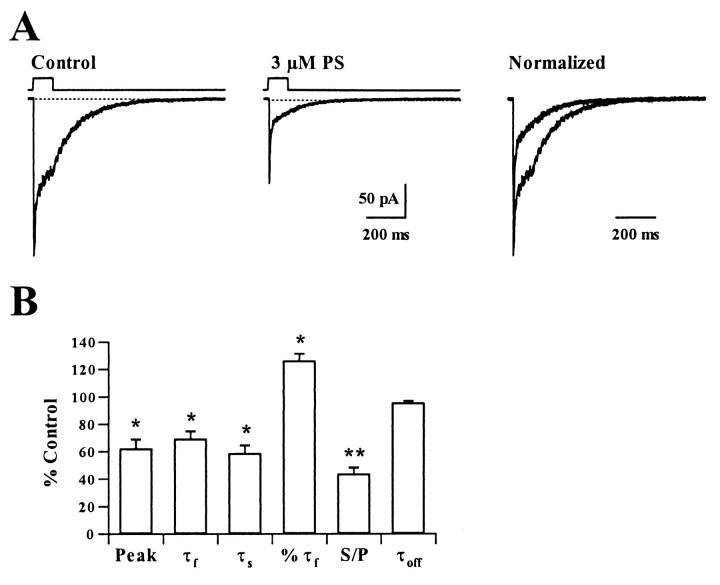
We examined the effects of the neurosteroid pregnenolone sulfate (PS) on GABA(A) receptor-mediated synaptic currents and currents elicited by rapid applications of GABA onto nucleated outside-out patches in cultured postnatal rat hippocampal neurons. At 10 microm, PS significantly depressed peak responses and accelerated the decay of evoked inhibitory synaptic currents. In nucleated outside-out patches, PS depressed peak currents and speeded deactivation after 5 msec applications of a saturating concentration of GABA. PS also increased the rate and degree of macroscopic GABA receptor desensitization during prolonged GABA applications. In a paired GABA application paradigm, PS slowed the rate of recovery from desensitization. In contrast to its prominent effects on currents produced by saturating GABA concentrations, PS had only small effects on peak currents and failed to alter deactivation after brief applications of the weakly desensitizing GABA(A) receptor agonists taurine and beta-alanine. However, when beta-alanine was applied for a sufficient duration to promote receptor desensitization, PS augmented macroscopic desensitization and slowed deactivation. These results suggest that PS inhibits GABA-gated chloride currents by enhancing receptor desensitization and stabilizing desensitized states. This contention is supported by kinetic modeling studies in which increases in the rate of entry into doubly liganded desensitized states mimic most effects of PS.


Figures

Fig. 1.
Fig. 1.
Effects of PS on IACs. A, The traces show the effects of 10 μm PS on inhibitory autaptic currents at a holding potential of −70 mV. Therightmost panel shows traces normalized with respect to peak response to highlight effects on the decay time course. Fast transients preceding IACs represent capacitive and ionic currents associated with presynaptic stimulation. B, The graph shows a summary of the effects of 10 μm PS on IACs from seven cells. Peak, Peak amplitude; τf, fast time constant of decay; τs, slow time constant of decay; % τf, relative contribution of the fast phase of decay. Error bars represent mean ± SEM. *p < 0.05; **p < 0.01 by paired t test.
Fig. 2.
Fig. 2.
GABA responses in nucleated outside-out patches.A, The traces show superimposition of 60 responses of a nucleated patch to 5 msec pulses of 1 mm GABA at a holding potential of −70 mV. The trace at the top in this and subsequent figures shows the response of the open patch pipette to changes in extracellular chloride concentration. B,C, The graphs show the 10–90% decay time (B) and the peak response (C) of the 60 traces displayed inA.
Fig. 3.
Fig. 3.
Effects of PS on deactivation of currents evoked by brief GABA pulses on nucleated outside-out patches.A, The traces depict the effects of 3 μmPS on responses activated by 5 msec applications of 1 mmGABA at a holding potential of −70 mV. The rightmost traces show responses normalized with respect to peak current to demonstrate effects on deactivation time course. B,The graph shows a summary of the effects of 3 μm PS on GABA currents in eight patches. Abbreviations are the same as in Figure1. *p < 0.05; **p < 0.01 by paired t test.
Fig. 4.
Fig. 4.
Effects of PS on GABA-mediated macroscopic desensitization. A, The traces show the effects of 3 μm PS on currents activated by 100 msec applications of 1 mm GABA on outside-out patches at a holding potential of −70 mV. The desensitization time course was evaluated by fitting a biexponential decay to the response during the GABA application. Therightmost traces again show responses normalized with respect to peak current to highlight changes in the time course and degree of receptor desensitization. B, The bar graph shows a summary of the effect of 3 μm PS on the rate and degree of desensitization to 100 msec pulses of 1 mm GABA in four patches. Abbreviations are the same as those in Figure 1 with the addition of S/P, ratio of steady-state current to peak current; and τoff, time constant describing the decay time constant after removal of drugs. *p< 0.05; **p < 0.01 by paired ttest.
Fig. 5.
Fig. 5.
Effects of PS on recovery from paired-pulse desensitization of GABA responses. A, B,The traces show responses produced by paired 5 msec applications of 1 mm GABA separated by 50, 80, 130, 200, 400, 800, 2000, and 4000 msec under control conditions (A) and in the presence of 10 μm PS. C, The graph shows the percentage of recovery from desensitization induced by the conditioning (first) pulse at different intervals. The percentage of recovery was calculated as [(peak 2 − peak 1)/(peak 1 − onset 2)] × 100. Peak 1 and peak 2 are the peak amplitudes of the first and second responses, and onset 2 is the value of the current at the start of the second response. Each data point represents the mean of five patches. The solid lines are fit the equation: % recovery = [100 − A1exp(−IPI/τ1) − A2exp(−IPI/τ2)] where τ1 and τ2 are the fast and slow time constants of recovery, and A1 and A2 are the amplitudes of the two components. In the fits shown, τ1 = 146.7 msec (41%) and τ2 = 2639 (29%) for control, and τ1 = 422.7 (33%) and τ2 = 4105.9 msec (43%) for PS.
Fig. 6.
Fig. 6.
Effects of PS on short pulses of taurine.A, The traces show currents activated by 5 msec pulses of 20 mm taurine administered to nucleated patches at a holding potential of −70 mV in the presence of 5 μmstrychnine under control conditions and in the presence of 10 μm PS. The rightmost panel shows traces normalized with respect to peak response. B, The graph shows a summary of the effects of 10 μm PS on taurine responses in seven patches.
Fig. 7.
Fig. 7.
Effects of PS on short and longer pulses of β-alanine. A, The traces show currents activated by 100 mm β-alanine in the absence and presence of 10 μm PS. The rightmost panel shows responses normalized with respect to peak current. B, In the same nucleated patch, a 200 msec application of β-alanine produces a small amount of desensitization. In the presence of 10 μm PS, desensitization is enhanced. The normalized traces highlight the change in desensitization, and the inset shows that PS prolongs the decay of β-alanine currents after agonist and drug removal.C, The graph shows the effects of 10 μm PS on peak responses and deactivation to 5 msec applications of 100 mm β-alanine. D, The graph shows the effects of PS on peak responses, the time constant of desensitization (τ), the ration of steady-state to peak currents (S/P), and deactivation τoff in response to 200 msec applications of β-alanine.
Fig. 8.
Fig. 8.
Kinetic modeling of PS effects on GABA and β-alanine currents. A, The left panelshows simulated responses to 5 msec applications of 1 mmGABA (solid trace) and the effects of threefold changes in either d2 (the fast desensitization rate, dashed traces) or d1 plus d2 (dotted traces). The right panel shows the effects of changes in d2 or d1 plus d2 on simulated responses to 200 msec applications of GABA. The inset in theleft panel shows the seven-state model used for simulations. Rate constants used in the modeling were derived fromMozrzymas et al. (1999) and Jones et al. (1998), withkon = 15 mm/msec−1,koff = 0.3 msec−1, α1 = 1.1 msec−1, β1 = 0.2 msec−1, α2 = 0.3 msec−1, β2 = 10 msec−1,d1 = 0.013 msec−1,r1 = 0.00013 msec−1, d2 = 2.0 msec−1, r2 = 0.045 msec−1, p = 0.0222 mm/msec−1, q = 0.002 msec−1. Abbreviations used in the model areR, unbound receptor; AR,A2R, bound states of the receptor with one or two agonist molecules; AR*, A2R*, open states of the ion channel;AD, A2D, desensitized receptor states. B, The panels show the effects of threefold changes in d2 and d1 plus d2 on simulated responses to 5 (left panel) and 200 msec (right panel) applications of 20 mm β-alanine. The effects of β-alanine were simulated using the approach outlined by Jones and Westbrook (1995) and Jones et al. (1998) withkon = 0.075 mm/msec−1 and koff = 10 msec−1. In these simulations, the rate constant,p, was adjusted to maintain microscopic reversibility.
Fig. 9.
Fig. 9.
Effects of changes in d2 and d1 plus d2 on simulated paired applications of GABA. A, B, The traces show the early time course of recovery from simulated 5 msec applications of 1 mm GABA in control conditions (A) and in the presence of a threefold increase in d2 (B). C, The plot displays the percentage of recovery of peak responses as a function of interpulse interval. The solid lines represent the best fit of a biexponential recovery process to the simulated responses. The time course of recovery was slowed by increases in d2 (squares) or d1 plus d2 (triangles). In the fits shown, τ1 = 132 msec (control), 227 msec (d2) and 213 msec (d1 plus d2), and τ2 = 9.3 sec (control), 13.0 sec (d2) and 13.5 sec (d1 plus d2), with % τ1 = 59% (control), 40% (d2), and 31% (d1 plus d2).

Similar articles

Cited by

References

    1. Banks MI, Pearce RA. Kinetic differences between synaptic and extrasynaptic GABAA receptors in CA1 pyramidal cells. J Neurosci. 2000;20:937–948. - PMC - PubMed
    1. Brickley SG, Cull-Candy SG, Farrant M. Single-channel properties of synaptic and extrasynaptic GABAA receptors suggest differential targeting of receptor subtypes. J Neurosci. 1999;19:2960–2973. - PMC - PubMed
    1. Baulieu E-E, Robel P. Neurosteroids: a new brain function? J Steroid Biochem Mol Biol. 1990;37:395–403. - PubMed
    1. Berger T, Schwarz C, Kraushaar U, Monyer H. Dentate gyrus basket cell GABAA receptors are blocked by Zn2+ via changes of their desensitization kinetics: an in situ patch-clamp and single-cell PCR study. J Neurosci. 1998;18:2437–2448. - PMC - PubMed
    1. Celentano JJ, Wong RKS. Multiphasic desensitization of the GABAA receptor in outside-out patches. Biophys J. 1994;66:1039–1050. - PMC - PubMed

Publication types

MeSH terms

LinkOut - more resources