

Morphology and growth patterns of developing thalamocortical axons
- PMID: 10804207
- PMCID: PMC6772677
- DOI: 10.1523/JNEUROSCI.20-10-03650.2000
Morphology and growth patterns of developing thalamocortical axons
Abstract
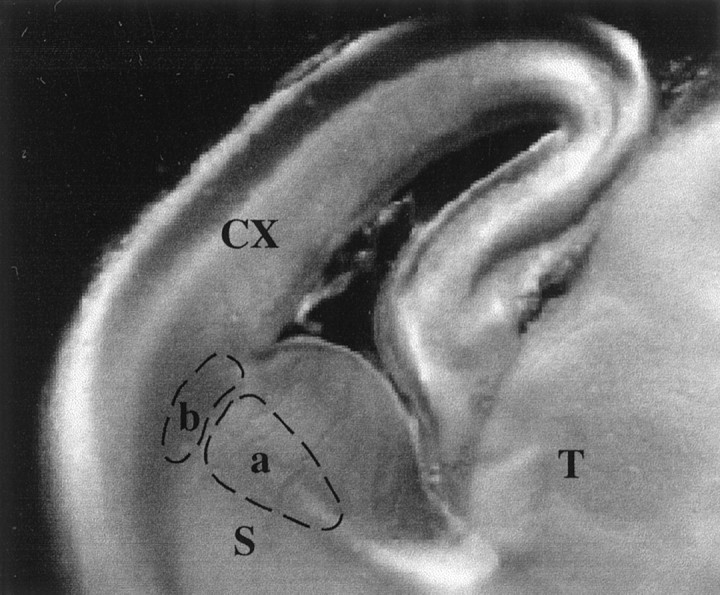
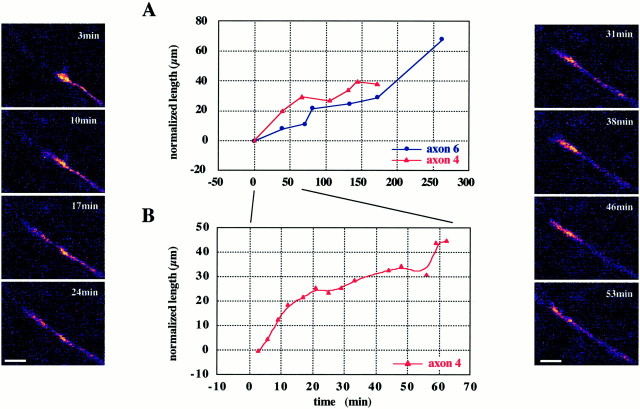
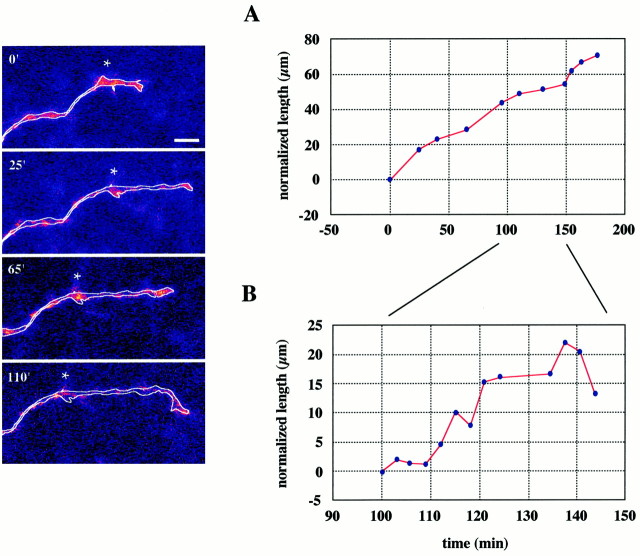
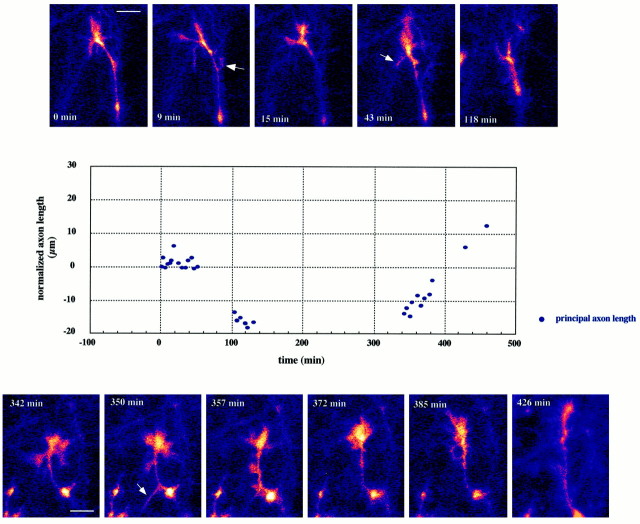
It is increasingly evident that the actions of guidance factors depend critically on the cellular and molecular context in which they operate. For this reason we examined the growth cone morphology and behavior of thalamic fibers in the relatively natural environment of a slice preparation containing the entire pathway from thalamus to cortex. Axons were labeled with DiI crystals and imaged with a laser-scanning confocal microscope for up to 8 hr. Their behavior was analyzed in terms of morphology, extension rates, shape of trajectory, frequency of branching, and percentage of time spent in advance, pause, and retraction. Thalamic fibers had distinct and stereotyped growth patterns that related closely to their position; within the striatum growth cones were small and elongated, rarely extending filopodia or side branches. Axons grew quickly, in straight trajectories, with minimal pauses or retractions. When they reached the ventral intermediate zone, axons slowed down, often coming to a complete stop for up to several hours, and their growth cones became larger and more complex. During pauses there were continuous extensions and retractions of filopodia and/or side branches. When advance resumed, it was often to a different direction. These results demonstrate consistent regional variations in growth patterns that identify an unexpected decision region for thalamic axons. They provide the basis for examining the roles of guidance cues in an accessible yet intact preparation of the thalamocortical pathway and allow for an evaluation of previously suggested pathfinding mechanisms.
Figures
Similar articles
-
Cortical and thalamic axon pathfinding defects in Tbr1, Gbx2, and Pax6 mutant mice: evidence that cortical and thalamic axons interact and guide each other.J Comp Neurol. 2002 May 20;447(1):8-17. doi: 10.1002/cne.10219. J Comp Neurol. 2002. PMID: 11967891
-
Dynamic behaviors of growth cones extending in the corpus callosum of living cortical brain slices observed with video microscopy.J Neurosci. 1994 Apr;14(4):2161-77. doi: 10.1523/JNEUROSCI.14-04-02161.1994. J Neurosci. 1994. PMID: 8158263 Free PMC article.
-
Netrin-1 promotes thalamic axon growth and is required for proper development of the thalamocortical projection.J Neurosci. 2000 Aug 1;20(15):5792-801. doi: 10.1523/JNEUROSCI.20-15-05792.2000. J Neurosci. 2000. PMID: 10908620 Free PMC article.
-
Mechanisms controlling the guidance of thalamocortical axons through the embryonic forebrain.Eur J Neurosci. 2012 May;35(10):1573-85. doi: 10.1111/j.1460-9568.2012.08119.x. Eur J Neurosci. 2012. PMID: 22607003 Free PMC article. Review.
-
Inputs from the thalamocortical system on axon pathfinding mechanisms.Curr Opin Neurobiol. 2014 Aug;27:143-50. doi: 10.1016/j.conb.2014.03.013. Epub 2014 Apr 17. Curr Opin Neurobiol. 2014. PMID: 24742382 Review.
Cited by
-
Structural basis for map formation in the thalamocortical pathway of the barrelless mouse.J Neurosci. 2006 Sep 27;26(39):10057-67. doi: 10.1523/JNEUROSCI.1263-06.2006. J Neurosci. 2006. PMID: 17005869 Free PMC article.
-
Axon growth regulation by a bistable molecular switch.Proc Biol Sci. 2018 Apr 25;285(1877):20172618. doi: 10.1098/rspb.2017.2618. Proc Biol Sci. 2018. PMID: 29669897 Free PMC article.
-
The effects of confinement on neuronal growth cone morphology and velocity.Biomaterials. 2014 Aug;35(25):6750-7. doi: 10.1016/j.biomaterials.2014.04.097. Epub 2014 May 16. Biomaterials. 2014. PMID: 24840617 Free PMC article.
-
Spontaneous activity regulates Robo1 transcription to mediate a switch in thalamocortical axon growth.Nat Neurosci. 2012 Jul 8;15(8):1134-43. doi: 10.1038/nn.3160. Nat Neurosci. 2012. PMID: 22772332
-
Growth of Thalamocortical Fibers to the Somatosensory Cortex in the Human Fetal Brain.Front Neurosci. 2017 Apr 27;11:233. doi: 10.3389/fnins.2017.00233. eCollection 2017. Front Neurosci. 2017. PMID: 28496398 Free PMC article.
References
-
- Agmon A, Connors BW. Thalamocortical responses of mouse somatosensory (barrel) cortex in vitro. Neuroscience. 1991;41:365–379. - PubMed
-
- Bagnard D, Betz H, Götz M, Püschel AW, Bolz J. Do semaphorins act as guidance molecules for afferent and efferent projections in the developing cerebral cortex? Soc Neurosci Abstr. 1996;22:1473.
-
- Bagnard D, Lohrum M, Uziel D, Püschel AW, Bolz J. Semaphorins act as attractive and repulsive guidance signals during the development of cortical projections. Development. 1998;125:5043–5053. - PubMed
Publication types
MeSH terms
Substances
LinkOut - more resources
Full Text Sources