. 2000 May 15;20(10):3822-9.
doi: 10.1523/JNEUROSCI.20-10-03822.2000.

Population vector coding by the giant interneurons of the cockroach

Affiliations

Population vector coding by the giant interneurons of the cockroach

R Levi et al. J Neurosci. .

Abstract

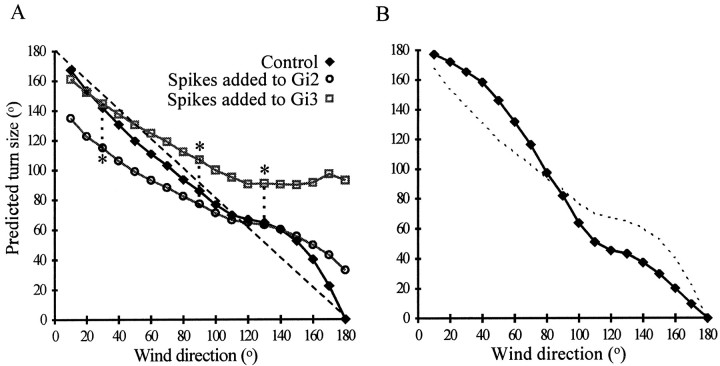
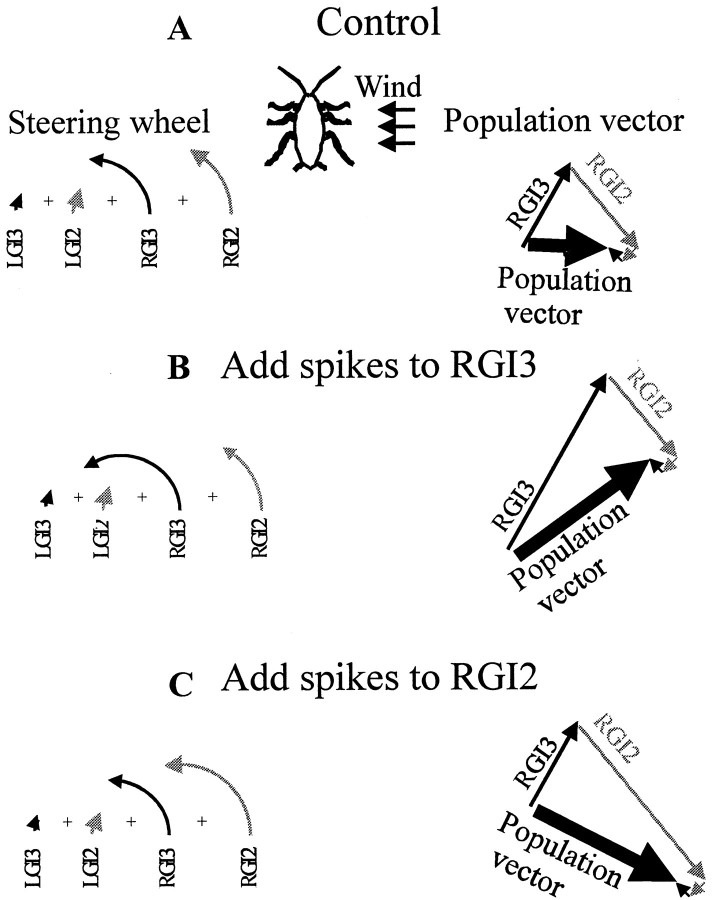
We tested two alternative models of integration among the cockroach giant interneurons (GIs) for determining the directions of wind-evoked escape turns. One model, called steering wheel, pits contralateral GIs against one another; the other, called population vector model, involves a vector computation among the GIs. In testing each model theoretically, the population vector was found to account far better for the actual behavior. Both models could account for the results of previous behavioral-physiological experiments in which spikes had been added to the right GI3 together with wind stimuli from the right side. The two models revealed a critical behavioral-physiological experimental test that we then performed; namely, when delivering wind from the right side, adding spikes experimentally to the right GI2 should increase turn size according to the steering wheel model but should decrease turn size according to the population vector model. The latter result was obtained. The population vector, but not the steering wheel, model also could account for previous behavioral-physiological experiments in which spikes were added experimentally to a GI contralateral to the wind stimuli. The results support the population vector model as accounting for direction determination among the cockroach GIs.


Figures

Fig. 1.
Fig. 1.
Steering wheel and population vector models, shown schematically. A, Input to each model: polar plots of the receptive fields of the GIs in response to wind from various angles about the cockroach in the horizontal plane. 0, Wind from the front; 180, wind from the rear;90R, 90L, wind orthogonally from the right and left, respectively. Solid lines, Right GIs 1, 2, and 3; dotted lines, their left homologs. Plots show numbers of spikes during the first 45 msec of the response to wind. Full length of each axis equals 10 spikes. The wind direction shown by the arrows (from 90° right) is the angle used inB and C (modified from Kolton and Camhi, 1995). B, Steering wheel, The length of a given arrow reflects the number of spikes evoked in the given GI in response to the 90° right wind stimulus.Arrow length also reflects differential weightings given to each GI (a GI3 spike being more effective than a GI2 spike).Arrows point in the directions of motor effect produced by each GI. The summation shown below would lead to a large left turn.Population vector, The direction of eacharrow indicates the preferred wind direction of a given GI. The length of each arrow shows the number of spikes it gives in response to the 90° right wind. The model calculates wind direction by vector summation (bottom panel). Turn direction is opposite the calculated wind direction.C, Turn direction produced by either the steering wheel or the population vector model.
Fig. 2.
Fig. 2.
Sizes of left turns predicted by the steering wheel model in response to wind stimuli from different right angles, from near 0° (“head-on” wind) to 180° (wind from rear).A, Dashed line indicates the theoretical turn sizes made by a cockroach that would turn perfectly away from the wind source. Filled diamonds, Simulation involving all three left and three right GIs. Open symbols, Turn sizes predicted by the model after adding five spikes to either right GI 2 or GI3. Asterisks, Specific predictions tested in the physiological experiments. (The effect of adding spikes to GI3 is greater than GI2, because GI3 has a higher weighting; see Results for explanation.) B, Dashed line, The same simulation as shown by the filled diamonds inA. The filled diamonds here show the predicted turn size when left and right GIs 1 are deleted from the simulation.
Fig. 3.
Fig. 3.
Sizes of left turns predicted by the population vector model in response to wind stimuli from different right angles, as in Figure 2. A, Dashed line indicates perfect turning exactly away from the wind source. Filled diamonds, Simulation involving all three left and three right GIs. Open symbols, Turn sizes predicted by the model after adding five spikes to either right GI2 or GI3. Asterisks, Specific predictions tested in the physiological experiments. B, Dashed line, The same simulation as shown by filled diamonds in part A. The filled diamonds here show the predicted turn size when left and right GIs 1 are deleted from the simulation.
Fig. 4.
Fig. 4.
Calculations of the effects via the steering wheel and the population vector codes of adding five spikes to right GIs 3 versus right GI2. A, Control, With no spikes added. Calculations shown are from Figure1B, bottom panels.B, The arrow for right GI3 is lengthened, indicting addition of spikes. See Results for explanation.C, The same for right GI2. See Results for explanation.
Fig. 5.
Fig. 5.
Effect of photoablation of right GI2 on the left-turning tendency. See Results for explanation.
Fig. 6.
Fig. 6.
A sample experiment. A, Intracellular recordings from the right GI2 before (top trace) and after (middle trace) photoablation, and with subsequent electrical stimulation (bottom trace). B, The effect of photoablation and of subsequent electrical stimulation of GI2 in the same animal as inA. The graph includes three trails for each treatment (means ± SEM).
Fig. 7.
Fig. 7.
Summed data from photoablation and subsequent electrical stimulation of right GI2. A, Mean instantaneous spike frequency of GI2 in response to wind puffs from 90° (control). The dashed line represents the frequency in response to electrical stimulation after photoablation. B, The left-turning tendency of the pooled animals before and after photoablation, and after electrical stimulation, of GI2. See Results for explanation.
Fig. 8.
Fig. 8.
Population vector model for wind from 90° left.A, Intact situation. B, Addition of spikes to right GI3 changes the population vector from 90° left to a right frontal angle. This would produce a large left turn.

References

    1. Abeles M, Gerstein G. Detecting spatiotemporal firing patterns among simultaneously recorded single neuron. J Neurophysiol. 1988;60:909–924. - PubMed
    1. Camhi JM. Escape behavior in the cockroach: distributed neural processing. Experientia. 1988;44:401–408. - PubMed
    1. Camhi JM, Levy A. Organization of a complex movement: fixed and variable components of the cockroach escape behavior. J Comp Physiol [A] 1988;163:317–328. - PubMed
    1. Camhi JM, Tom W. The escape behavior of the cockroach Periplaneta americana. I. Turning response to wind puffs. J Comp Physiol [A] 1978;128:193–201.
    1. Comer C. Analyzing cockroach escape behavior with lesions of individual giant interneurons. Brain Res. 1985;335:342–346. - PubMed

Publication types

LinkOut - more resources