. 2000 Jun;20(11):3772-80.
doi: 10.1128/MCB.20.11.3772-3780.2000.

Analysis of ku80-mutant mice and cells with deficient levels of p53

Affiliations

Analysis of ku80-mutant mice and cells with deficient levels of p53

D S Lim et al. Mol Cell Biol. 2000 Jun.

Abstract

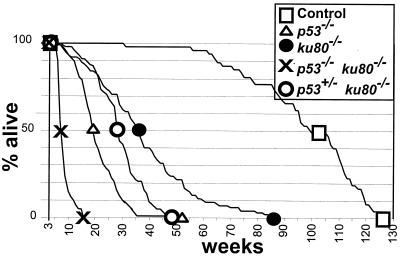
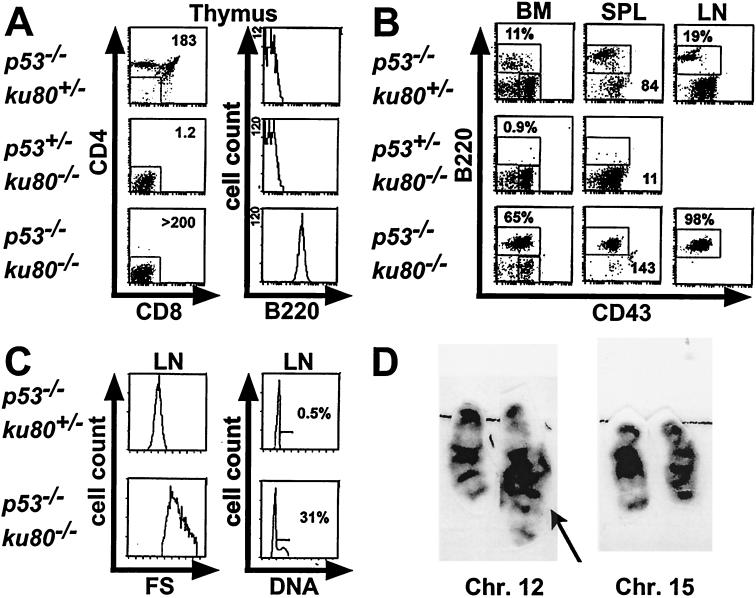
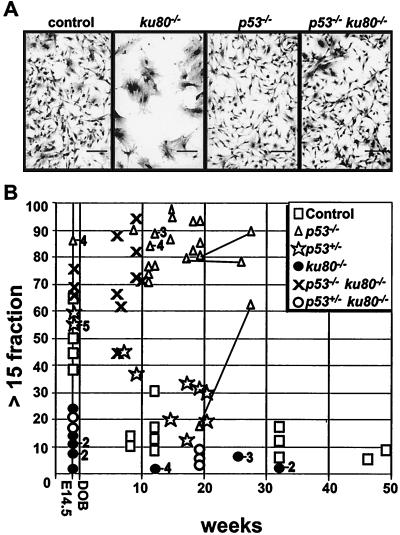
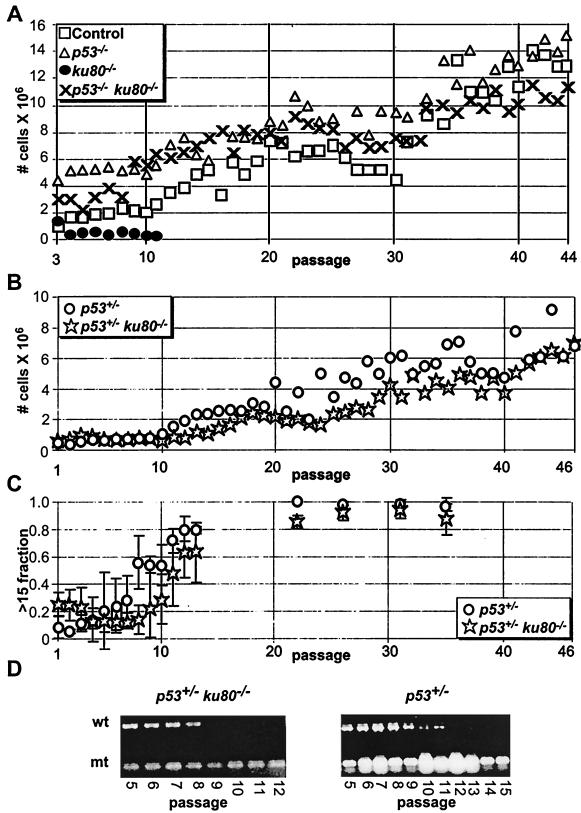
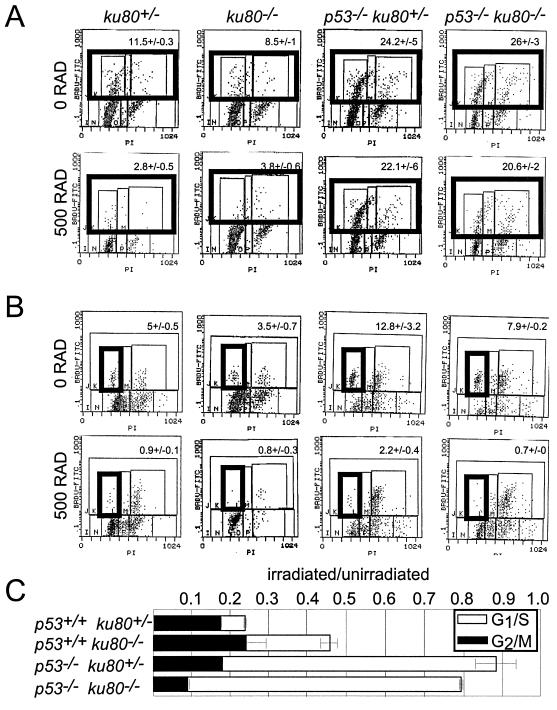
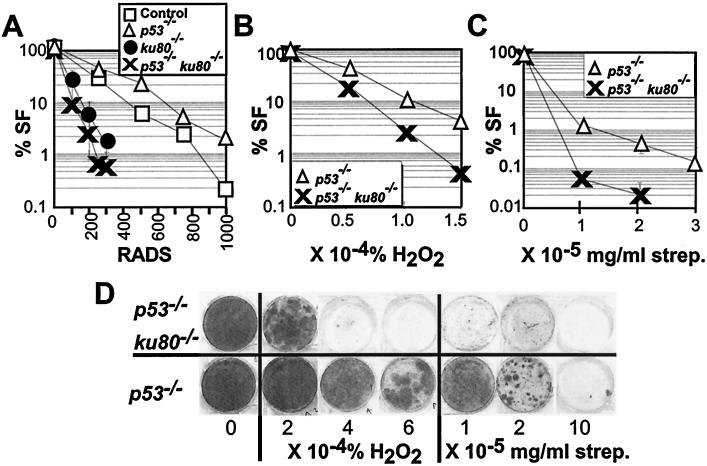
Absence of Ku80 results in increased sensitivity to ionizing radiation, defective lymphocyte development, early onset of an age-related phenotype, and premature replicative senescence. Here we investigate the role of p53 on the phenotype of ku80-mutant mice and cells. Reducing levels of p53 increased the cancer incidence for ku80(-/-) mice. About 20% of ku80(-/-) p53(+/-) mice developed a broad spectrum of cancer by 40 weeks and all ku80(-/-) p53(-/-) mice developed pro-B-cell lymphoma by 16 weeks. Reducing levels of p53 rescued populations of ku80(-/-) cells from replicative senescence by enabling spontaneous immortalization. The double-mutant cells are impaired for the G(1)/S checkpoint due to the p53 mutation and are hypersensitive to gamma-radiation and reactive oxygen species due to the Ku80 mutation. These data show that replicative senescence is caused by a p53-dependent cell cycle response to damaged DNA in ku80(-/-) cells and that p53 is essential for preventing very early onset of pro-B-cell lymphoma in ku80(-/-) mice.


Figures

FIG. 1
FIG. 1
Life span and mortality. The survival curve begins after weaning (3 weeks) because deletion of Ku80 genes reduced fitness that often resulted in neonatal death (30). Symbols are shown at the points of 100, 50, and 0% survival. Observed were 47 control mice, 124 p53−/− mice, 89 ku80−/− mice, 41 p53−/− ku80−/− mice, and 85 p53+/− ku80−/− mice.
FIG. 2
FIG. 2
Flow cytometric tumor analysis. Moribund p53−/− ku80−/− mice showing signs of enlarged lymph nodes or thymi were subjected to necropsy, and cell suspensions were stained for CD4, CD8, B220, and CD43. Representative profiles are shown for an 8-week-old p53−/− ku80+/− mouse, a 16-week-old p53+/− ku80−/− mouse, and an 8-week-old p53−/− ku80−/− mouse. Lymphocytes with appropriate forward and side scatter properties were initially gated (not shown) for all profiles. (A) Triple-stained (CD4, CD8, B220) thymocytes are displayed in two histograms. The left panels show CD4 and CD8 profiles. Thymocytes that were negative for CD4 and CD8 were gated (indicated by boxed area) and shown for B220 expression in the second panel. Total thymic cellularity (106) is shown in the upper right corner of the CD4 and CD8 profiles. (B) Histograms of double-stained (B220, CD43) bone marrow (BM), spleen (SPL), and lymph node (LN) cell suspensions are shown. The percentage of B220+ cells is indicated for bone marrow and lymph node cells. For the spleen profiles, the total weight (in milligrams) of intact spleen, prior to preparation of cell suspensions, is shown in the lower right corner. (C) Forward scatter (FS) and DNA content profiles on LN cells that fell into the B220+ gate (boxed area in B220 and CD43 profiles shown in panel B). The mean forward scatter, proportional to cell size, is almost doubled for p53−/− ku80−/− lymph node cells compared to those from p53−/− ku80+/− mice. Over 30% of the lymph node tumor cells are in S/G2 phase. This is in contrast to control lymph node cells which are virtually all resting in G0/G1, an expected result in a genetically normal, antigenically unchallenged animal in a pathogen-free facility. Fluorescence parameters are expressed on a log scale while cell count, forward scatter, and DNA content are on a linear scale. It should be noted that lymph nodes from p53+/− ku80−/− mice were not harvested since they were difficult to find. (D) G-Band karyotype analysis showing chromosomes 12 and 15 from a p53−/− ku80−/− lymphoma. Translocation involving the terminal band of chromosome 12 is indicated by the arrow. This finding was present in 9 out of 9 metaphases examined.
FIG. 3
FIG. 3
Analysis of individual cells at early passage. (A) MEF morphology. Passage 2 cells were plated (5.3 × 10⁴ cells/3.5-cm plate) and grown for 5 days before staining. Scale bar = 125 μm. (B) Cross-sectional CSD. The fraction of colonies with >15 cells out of the total number of colonies with >3 cells is shown. Symbols are the same as in Fig. 1 with the addition of a star to represent p53+/−. Numbers to the right of a symbol represent the number of clones observed at that point if greater than one. MEF were observed at passage 2 and MSF were observed at passage 1. Skin fibroblasts derived from three p53−/− mice were analyzed at two time points (joined by lines). All other points represent fibroblasts derived from different mice.
FIG. 4
FIG. 4
Analysis of clonal populations of cells. Symbols are the same as in Fig. 1 and 3. (A) 3T3 equivalent analysis of control, p53−/−, ku80−/−, and p53−/− ku80−/− MEF. Graph starts with passage 3 MEF. The averages of clones are shown for control (n = 2), p53−/− (n = 3), ku80−/− (n = 2), and p53−/− ku80−/− (n = 2) mice. (B) 3T3 equivalent analysis of p53+/− and p53+/− ku80−/− MSF. Graph starts with passage 1 MSF. The averages of clones are shown for p53+/− (n = 5) and p53+/− ku80−/− (n = 3) MSF. (C) Companion CSD with >15-cell fractions. The fraction of colonies with >15 cells out of the total number of colonies composed of >3 cells is shown. Cells were taken from the 3T3 equivalent analysis presented in panel B. (D) Loss of heterozygosity of p53 shown by genotyping by PCR. Wild-type (wt) and mutant (mt) bands are shown.
FIG. 5
FIG. 5
Cell cycle checkpoints induced by ionizing radiation. (A) Representative histographs for the analysis of the G1/S checkpoint exposed to either 0 or 500 rad. BrdU-labeled cells appear in the top three boxes of each histograph, which are outlined by one box in bold. The average percentage (± standard deviation) of cells labeled with BrdU is shown at the top of each histograph. (B) Representative histographs for the analysis of the G2/M checkpoint exposed to either 0 or 500 rad. BrdU-labeled cells in G1 are shown in the box in bold. The average percentage (± standard deviation) of G1 cells labeled with BrdU is at the top of the histograph. (C) Graph depicting the G1/S (open bar) and G2/M (closed bar) checkpoints. For the G1/S checkpoint, the fraction of irradiated BrdU-labeled cells is divided by the fraction of unirradiated BrdU-labeled cells. For the G2/M checkpoint, the fraction of irradiated BrdU-labeled cells in G1 is divided by the fraction of unirradiated BrdU-labeled cells in G1. The averages of clones are shown for control (n = 2), p53−/− (n = 5), ku80−/− (n = 5), and p53−/− ku80−/− (n = 2) cells.
FIG. 6
FIG. 6
Genotoxic analysis. (A to C) Dose-response curves to genotoxic agents. The percent survival fraction (% SF) is shown (100% × [the number of colonies exposed to genotoxic agent/the number of colonies not exposed to genotoxic agent]). Symbols are the same as in Fig. 1. (A) Dose response to γ-radiation. Graph depicts survival fraction when cells were plated at low density. The averages of clones are shown for control (n = 2), p53−/− (n = 3), ku80−/− (n = 2), and p53−/− ku80−/− (n = 2). (B) Dose response to H2O2. Graph depicts survival fraction when cells were plated at low density. A clone of p53−/− and p53−/− ku80−/− cells was analyzed. (C) Dose response to streptonigrin. Graph depicts survival fraction when cells were plated at high density. The averages of clones are shown for control p53−/− (n = 4) and p53−/− ku80−/− (n = 2) cells. (D) Dose response to H2O2 or streptonigrin for cells plated at high density. Shown are representative 3.5-cm-diameter wells that were originally plated with 2 × 10⁵ cells and grown for 2 weeks before staining. Unexposed cells are shown at the left (labeled with a 0).

Similar articles

Cited by

References

    1. Bernstein C, Bernstein H. Aging, sex, and DNA repair. San Diego, Calif: Academic Press; 1991.
    1. Biedermann K A, Sun J, Giaccia A J, Tosto L M, Brown M. scid mutation in mice confers hypersensitivity to ionizing radiation and deficiency in DNA double-strand break repair. Proc Natl Acad Sci USA. 1991;88:1394–1397. - PMC - PubMed
    1. Bogue M A, Wang C, Zhu C, Roth D B. V(D)J recombination in Ku86-deficient mice: distinct effects on coding, signal, and hybrid joint formation. Immunity. 1997;7:37–47. - PubMed
    1. Bogue M A, Zhu C, Aguilar-Cordova E, Donehower L A, Roth D B. p53 is required for both radiation-induced differentiation and rescue of V(D)J rearrangement in scid mouse thymocytes. Genes Dev. 1996;10:1–13. - PubMed
    1. Bond J A, Haughton M F, Rowson J M, Smith P J, Gire V, Wynford-Thomas D, Wyllie F S. Control of replicative life span in human cells: barriers to clonal expansion intermediate between M1 senescence and M2 crisis. Mol Cell Biol. 1999;19:3103–3114. - PMC - PubMed

Publication types

MeSH terms