. 2000 Jun;20(11):4135-48.
doi: 10.1128/MCB.20.11.4135-4148.2000.

Altered activity, social behavior, and spatial memory in mice lacking the NTAN1p amidase and the asparagine branch of the N-end rule pathway

Affiliations

Altered activity, social behavior, and spatial memory in mice lacking the NTAN1p amidase and the asparagine branch of the N-end rule pathway

Y T Kwon et al. Mol Cell Biol. 2000 Jun.

Abstract

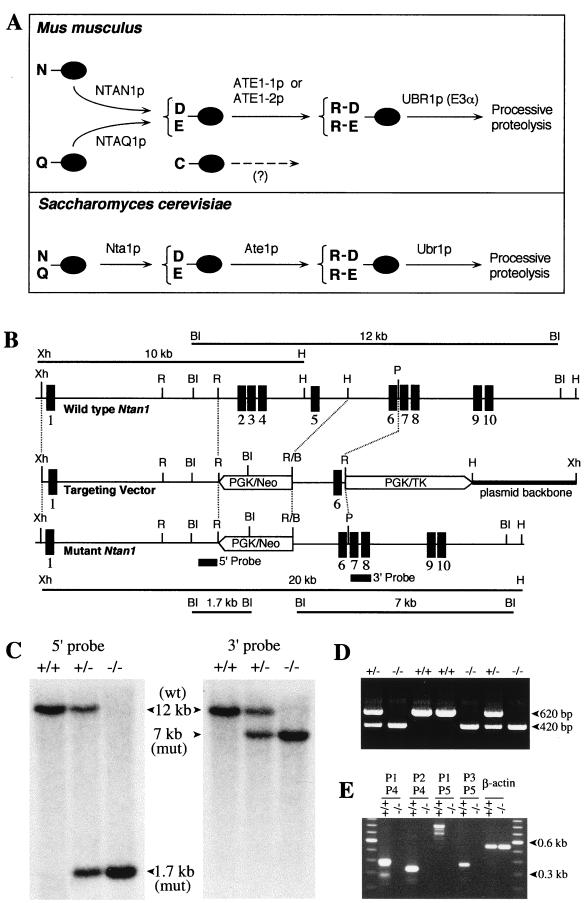
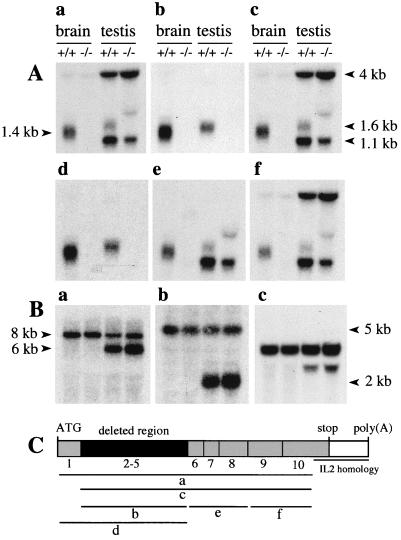
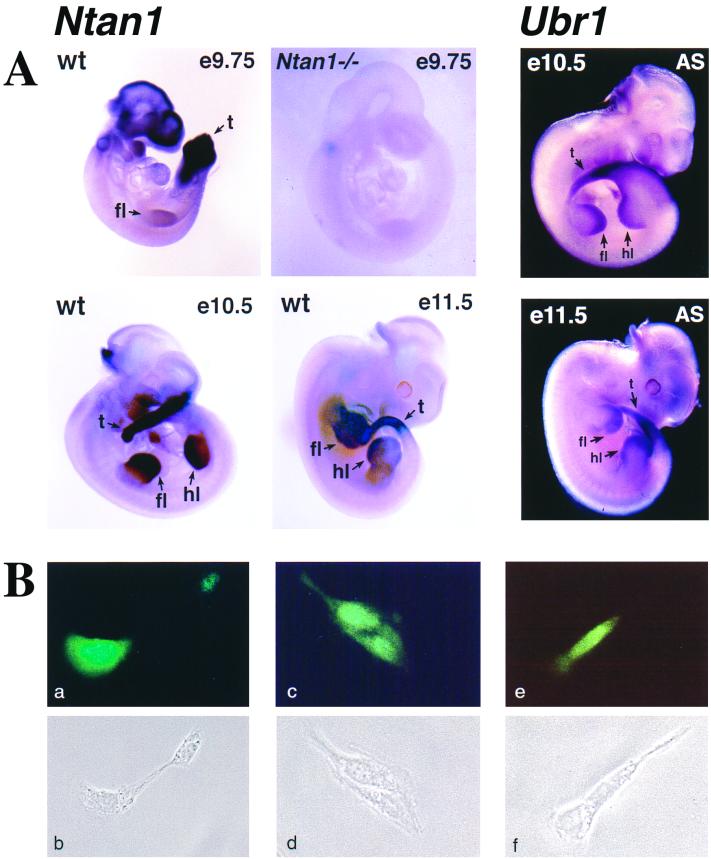
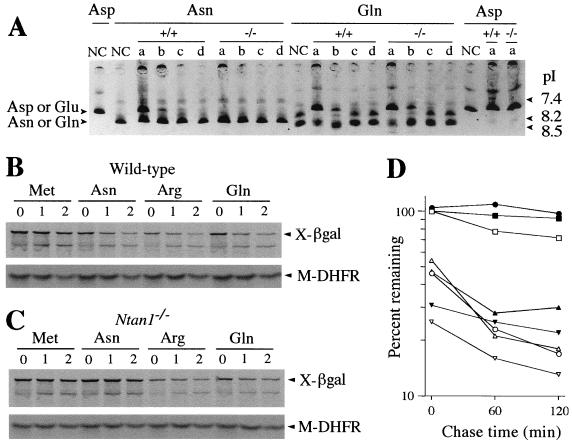
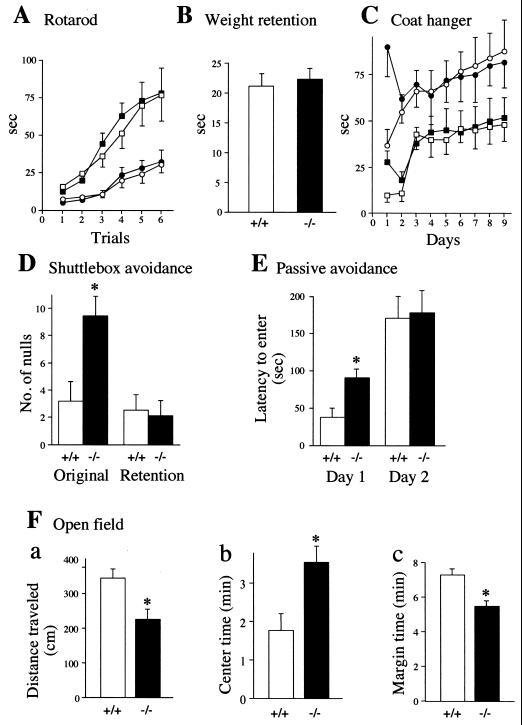
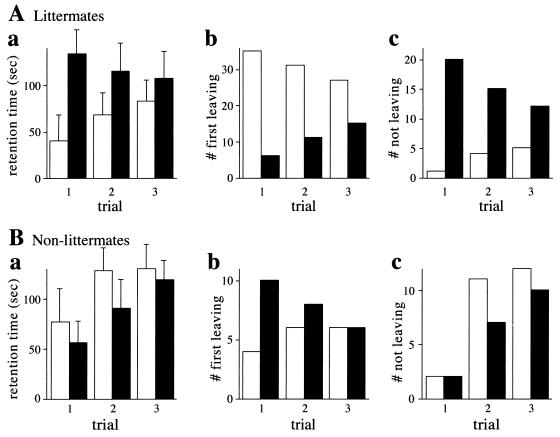
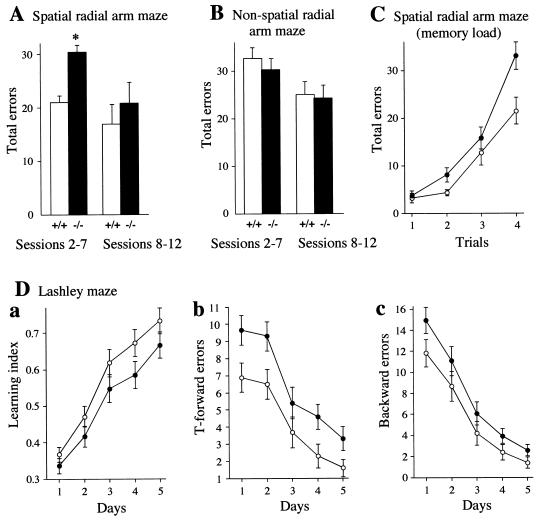
The N-end rule relates the in vivo half-life of a protein to the identity of its N-terminal residue. N-terminal asparagine and glutamine are tertiary destabilizing residues, in that they are enzymatically deamidated to yield secondary destabilizing residues aspartate and glutamate, which are conjugated to arginine, a primary destabilizing residue. N-terminal arginine of a substrate protein is bound by the Ubr1-encoded E3alpha, the E3 component of the ubiquitin-proteasome-dependent N-end rule pathway. We describe the construction and analysis of mouse strains lacking the asparagine-specific N-terminal amidase (Nt(N)-amidase), encoded by the Ntan1 gene. In wild-type embryos, Ntan1 was strongly expressed in the branchial arches and in the tail and limb buds. The Ntan1(-/-) mouse strains lacked the Nt(N)-amidase activity but retained glutamine-specific Nt(Q)-amidase, indicating that the two enzymes are encoded by different genes. Among the normally short-lived N-end rule substrates, only those bearing N-terminal asparagine became long-lived in Ntan1(-/-) fibroblasts. The Ntan1(-/-) mice were fertile and outwardly normal but differed from their congenic wild-type counterparts in spontaneous activity, spatial memory, and a socially conditioned exploratory phenotype that has not been previously described with other mouse strains.


Figures

FIG. 1
FIG. 1
Deletion-disruption of the mouse Ntan1 gene. (A) Comparison of enzymatic reactions that underlie the activity of tertiary and secondary destabilizing residues in the yeast S. cerevisiae and the mouse. N-terminal residues are indicated by single-letter abbreviations for amino acids. The ovals denote the rest of a protein substrate. The Ntan1-encoded mammalian NtN-amidase converts N-terminal Asn to Asp. N-terminal Gln is deamidated by NtQ-amidase, which remains to be isolated (see text). In contrast, the yeast Nt-amidase Nta1p can deamidate either N-terminal Asn or Gln (6). The secondary destabilizing residues Asp and Glu are arginylated by the mammalian ATE1-1p or ATE1-2p R-transferase (34). A Cys-specific mammalian R-transferase (23) remains to be identified. N-terminal Arg, one of the primary destabilizing residues, is recognized by N-recognin, the E3 component of the N-end rule pathway (63). (B) Targeting strategy. Top, partial restriction map of the mouse Ntan1 gene; middle, structure of the targeting vector; bottom, structure of the deletion-disruption Ntan1 allele. Exons are denoted by solid vertical bars. The directions of transcription of the neo and tk genes are indicated. Homologous recombination resulted in the replacement of the Ntan1 exons 2 to 5 with the neo cassette. Probes for Southern hybridization are indicated by solid rectangles. Restriction sites: Xh, XhoI; R, EcoRI; BI, BamHI; H, HindIII; P, PstI. (C) Southern analysis of BamHI-digested tail DNA from wild-type (+/+), heterozygous (Ntan1+/−), and Ntan1−/− mice. The 5′ probe yielded the 12- and 1.7-kb Ntan1 fragments for the wild-type (wt) and mutant (mut) Ntan1 alleles, respectively; the 3′ probe detected 12- and 7-kb fragments. The organization of the deletion-disruption allele was independently verified by Southern analysis of the XhoI-HindIII-digested tail DNA (data not shown). (D) PCR analysis of tail DNA. The primers were 5′-GCCACTTGTGTAGCGCCAAGTGCCAGC (for neo, forward), 5′-CTTCCCACCAAGCCTGACTGTTGATC (for Ntan1, forward) and 5′-CTTCAATTTCTGTGCTCAGCTAAGCTC (for Ntan1, reverse). (E) RT-PCR analysis of the total RNA isolated from +/+ and Ntan1−/− EF cells, using primers P1 (for exon 1), P2 (exon 2), P3 (exon 6), P4 (exon 5), and P5 (exon 10). β-Actin mRNA was used as a control, at the 20-fold-lower primer concentration in comparison to other lanes.
FIG. 2
FIG. 2
Northern hybridization analysis of the total RNA isolated from +/+ and Ntan1−/− brains and testes. (A) Hybridization using probes a to f that encompassed different regions of the Ntan1 cDNA (indicated in panel C). (B) The same Northern blots were hybridized with probes specific, respectively, for the mouse Ubr1, Ate1, and β-actin cDNAs. (C) Exons of Ntan1 and the hybridization probes used. The sequence of a 208-bp segment of the Ntan1 cDNA (nt 896 to 930), termed the IL-2 homology region, is 98.6% identical to the sequence of a 206-bp segment in the 3′-flanking untranslated region of the mouse Il2 gene, which encodes IL-2 (24).
FIG. 3
FIG. 3
Expression of Ntan1 mRNA and localization of NTAN1p. (A) Whole-mount in situ hybridization of wild-type (wt) and Ntan1−/− embryos (left four panels, light background) with an antisense RNA probe derived from a 0.3-kb fragment of the Ntan1 cDNA (nt 108 to 448) that was absent from the Ntan1−/− allele. The regions of high Ntan1 expression in the tail buds (t), forelimb buds (fl), and hindlimb buds (hl) are indicated. The right two panels (dark background) show the results of in situ hybridization with an antisense (AS) Ubr1 cDNA probe. (B) Intracellular localization of mouse NTAN1p. NIH 3T3 cells were transiently transfected with a plasmid expressing the NTAN1p-GFP fusion (see Materials and Methods). Typical fluorescence patterns (a, c, and e) and the matching phase-contrast images (b, d, and f) are shown (see text).
FIG. 4
FIG. 4
Mouse Ntan1−/− cells lack NtN-amidase and are unable to degrade the normally short-lived N-end rule substrates bearing N-terminal Asn. (A) 35S-labeled, purified X-DHFR test proteins (X = Asn, Gln, or Asp) were incubated for 2 h at 37°C with buffer alone (negative controls [NC]) or with extracts from either wild-type or Ntan1−/− EF cells, followed by IEF and autoradiography. The assays were carried using either the initial extracts (lanes a) or the same extracts diluted with buffer 10-, 100-, and 1,000-fold (lanes b, c, and d, respectively). The IEF positions of X-DHFRs bearing N-terminal Asp or Glu versus Asn or Gln are shown on the left. The corresponding pH values are indicated on the right. (B) Immortalized +/+ and Ntan1−/− EF cells (see Materials and Methods) were transiently transfected with plasmid pRC/dhaUbXnsP4βgal, which expressed DHFR-HA-UbR48-X-nsP4βgal test proteins (X = Met, Asn, Gln, or Arg) (40). These proteins were cotranslationally cleaved in vivo by DUBs, yielding the long-lived reference protein DHFR-HA-UbR48 and the test protein X-nsP4βgal (X = Met, Asn, Gln, or Arg) (see text). Cells were labeled with [35S]methionine-cysteine, followed by a chase for 0, 1, and 2 h (as indicated at the top) in the presence of cycloheximide, preparation of extracts, immunoprecipitation, SDS-PAGE, autoradiography, and quantitation, essentially as described elsewhere (40). The bands of X-nsP4βgal proteins and the DHFR-HA-UbR48 reference protein are indicated on the right as X-βgal and DHFR. (C) Same as panel B but with immortalized Ntan1−/− EF cells. (D) Quantitation of the in vivo degradation of X-nsP4βgal test proteins using the reference-based pulse-chase patterns in panels B and C (see Materials and Methods). The amounts of 35S in an X-nsP4βgal protein, relative to 35S in the DHFR-HA-UbR48 reference protein at the same time points, were plotted as percentages of this ratio for Met-nsP4βgal at time zero. (Met-nsP4βgal bore a stabilizing N-terminal residue.) Open and closed symbols, wild-type and Ntan1−/− EF cells, respectively; □ and ■, Met-nsP4βgal; ○ and ●, Asn-nsP4βgal; ▿ and ▾, Arg-nsP4βgal; ▵ and ▴, Gln-nsP4βgal.
FIG. 5
FIG. 5
Normal motor coordination and reduced spontaneous activity of Ntan1−/− mice. Open symbols: +/+ mice; solid symbols: congenic Ntan1−/− mice (see Materials and Methods). Statistically significant differences (P < 0.05) are indicated by ∗. Experiments used 24 Ntan1−/− mice and their congenic +/+ littermates (A to C) or nonlittermates (D to G). (A) Rotarod test. Data show time elapsed before the animals fell from a horizontal rod rotating at 10 rpm (squares) or 20 rpm (circles). No significant differences were found between +/+ and Ntan1−/− mice. (B) Weight retention test. Data show time elapsed before the animals released a hook. The height of each bar represents the time averaged from 360 trials. There were no significant differences between +/+ and Ntan1−/− mice. (C) Coat hanger test. Squares, time elapsed before the animal grabbed the horizontal bar with both rear paws; circles, time elapsed before the front two paws reached one of the side bars. Each data point is an average of 48 trials. There were no significant differences between +/+ and Ntan1−/− mice. (D) Shuttlebox avoidance test. Shown are the number of null responses per 50 daily trials in which the mouse remained in the original compartment of the shuttlebox and received 20 s of electric shock during the original learning and retention testing 7 to 10 weeks later. (E) Passive avoidance test, measuring time before entering a dark chamber after an automated guillotine door opened, exposing the dark chamber. On day 1 the mice were shocked after entering the dark chamber; 13 Ntan1−/− mice and 12 congenic +/+ mice were used. (F) Open-field test. Shown are the total distance traveled by the animal during the observation time of 9 min (a), time (out of 9 min in total) that the animal spent in the center area (b), and time (out of 9 min in total) that the animal spent within 1 cm of the walls. This set of tests used 28 Ntan1−/− mice and 27 congenic +/+ mice.
FIG. 6
FIG. 6
Socially conditioned differences in exploratory behavior between +/+ and congenic Ntan1−/− mice. Open bars, +/+ mice; solid bars, congenic Ntan1−/− mice. In the platform-leaving test, one Ntan1−/− mouse and one +/+ mouse (either a littermate or a nonlittermate) were placed, at the same time, on a 16- by 22- by 2.7-cm platform. Mice were allowed to either explore or step down from the platform until the cutoff time of 180 s. Bars show the time by which each animal left the platform (a), the number of animals, of each genotype, leaving first (b), and the number of animals, of each genotype, not leaving by the cutoff time (c). Four independent sets of tests (at least 10 pairs of mice per test) were carried out over 6 months, using 44 pairs of +/+ and Ntan1−/− littermates, which were produced through heterozygous matings and identified by genotyping ∼700 mice. The results differed by less than 15% among the independent tests. (B) Same as panel A except with pairs of nonlittermates (24 +/+ mice and 24 Ntan1−/− mice).
FIG. 7
FIG. 7
Spatial learning and memory in Ntan1−/− mice. Open symbols and bars represent +/+ mice; solid symbols and bars represent congenic Ntan1−/− mice. See the text for details. (A to C) Results for 10 +/+ mice and 10 Ntan1−/− mice. (A) Mean daily errors made by mice for each phase in the spatial radial arm maze. The data were separated into those for acquisition phase (sessions 2 to 7) and asymptotic phase (sessions 8 to 12). (B) Same as panel A except that the mice were tested in the nonspatial radial arm maze, in which the spatial cues were replaced by nonspatial cues. (C) Effects of memory load in the water version of the spatial radial arm maze. Shown are total errors per trial. (D) Performance of 29 +/+ mice and 30 congenic Ntan1−/− mice in the Lashley maze. Shown are the ratio of the number of correct path segments taken to the total number of segments (learning index) (a), errors in T-choices (b), and errors made by moving away from the goal (c).

References

    1. Alagramam K, Naider F, Becker J M. A recognition component of the ubiquitin system is required for peptide transport in Saccharomyces cerevisiae. Mol Microbiol. 1995;15:225–234. - PubMed
    1. Ausubel F M, Brent R, Kingston R E, Moore D D, Smith J A, Seidman J G, Struhl K, editors. Current protocols in molecular biology. New York, N.Y: Wiley-Interscience; 1998.
    1. Bachmair A, Finley D, Varshavsky A. In vivo half-life of a protein is a function of its amino-terminal residue. Science. 1986;234:179–186. - PubMed
    1. Bachmair A, Varshavsky A. The degradation signal in a short-lived protein. Cell. 1989;56:1019–1032. - PubMed
    1. Baker R T, Varshavsky A. Inhibition of the N-end rule pathway in living cells. Proc Natl Acad Sci USA. 1991;87:2374–2378. - PMC - PubMed

Publication types