

Molecular basis for a link between complement and the vascular complications of diabetes
- PMID: 10805801
- PMCID: PMC25849
- DOI: 10.1073/pnas.97.10.5450
Molecular basis for a link between complement and the vascular complications of diabetes
Abstract
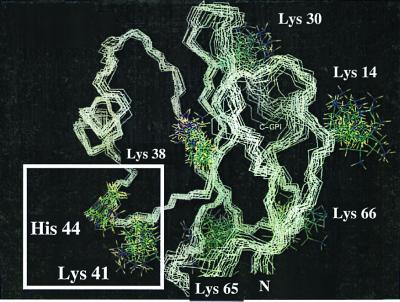
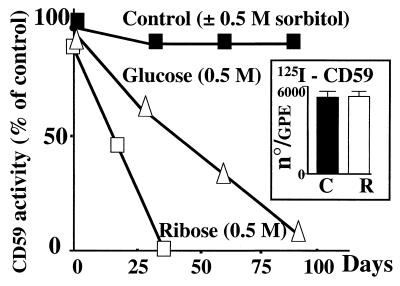
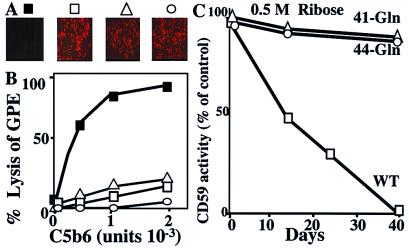
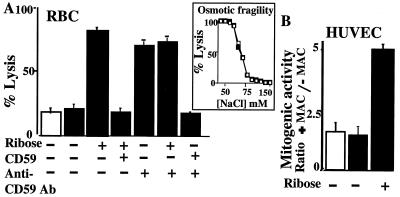
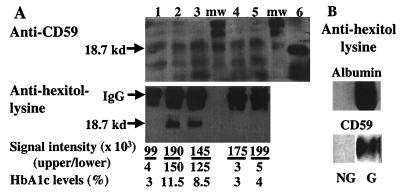
Activated terminal complement proteins C5b to C9 form the membrane attack complex (MAC) pore. Insertion of the MAC into endothelial cell membranes causes the release of growth factors that stimulate tissue growth and proliferation. The complement regulatory membrane protein CD59 restricts MAC formation. Because increased cell proliferation characterizes the major chronic vascular complications of human diabetes and because increased glucose levels in diabetes cause protein glycation and impairment of protein function, we investigated whether glycation could inhibit CD59. Glycation-inactivation of CD59 would cause increased MAC deposition and MAC-stimulated cell proliferation. Here, we report that (i) human CD59 is glycated in vivo, (ii) glycated human CD59 loses its MAC-inhibitory function, and (iii) inactivation of CD59 increases MAC-induced growth factor release from endothelial cells. We demonstrate by site-directed mutagenesis that residues K41 and H44 form a preferential glycation motif in human CD59. The presence of this glycation motif in human CD59, but not in CD59 of other species, may help explain the distinct propensity of humans to develop vascular proliferative complications of diabetes.
Figures
Similar articles
-
Glycation inactivation of the complement regulatory protein CD59: a possible role in the pathogenesis of the vascular complications of human diabetes.Diabetes. 2004 Oct;53(10):2653-61. doi: 10.2337/diabetes.53.10.2653. Diabetes. 2004. PMID: 15448097
-
A distinctive histidine residue is essential for in vivo glycation-inactivation of human CD59 transgenically expressed in mice erythrocytes: Implications for human diabetes complications.Am J Hematol. 2017 Nov;92(11):1198-1203. doi: 10.1002/ajh.24886. Epub 2017 Sep 8. Am J Hematol. 2017. PMID: 28815695 Free PMC article.
-
Insights into the human CD59 complement binding interface toward engineering new therapeutics.J Biol Chem. 2005 Oct 7;280(40):34073-9. doi: 10.1074/jbc.M504922200. Epub 2005 Aug 3. J Biol Chem. 2005. PMID: 16079145
-
Role of complement and complement regulatory proteins in the complications of diabetes.Endocr Rev. 2015 Jun;36(3):272-88. doi: 10.1210/er.2014-1099. Epub 2015 Apr 10. Endocr Rev. 2015. PMID: 25859860 Free PMC article. Review.
-
The role of complement membrane attack complex in dry and wet AMD - From hypothesis to clinical trials.Exp Eye Res. 2019 Jul;184:266-277. doi: 10.1016/j.exer.2019.05.006. Epub 2019 May 10. Exp Eye Res. 2019. PMID: 31082363 Review.
Cited by
-
Association between red blood cell distribution width and macrovascular and microvascular complications in diabetes.Diabetologia. 2012 Jan;55(1):226-35. doi: 10.1007/s00125-011-2331-1. Epub 2011 Oct 15. Diabetologia. 2012. PMID: 22002006
-
Associations of dicarbonyl stress with complement activation: the CODAM study.Diabetologia. 2020 May;63(5):1032-1042. doi: 10.1007/s00125-020-05098-4. Epub 2020 Jan 28. Diabetologia. 2020. PMID: 31993713 Free PMC article.
-
Novel Biochemical Markers of Glycemia to Predict Pregnancy Outcomes in Women With Type 1 Diabetes.Diabetes Care. 2021 Mar;44(3):681-689. doi: 10.2337/dc20-2360. Epub 2021 Jan 25. Diabetes Care. 2021. PMID: 33495292 Free PMC article.
-
Plasma Glycated CD59 Predicts Early Gestational Diabetes and Large for Gestational Age Newborns.J Clin Endocrinol Metab. 2020 Apr 1;105(4):e1033-40. doi: 10.1210/clinem/dgaa087. J Clin Endocrinol Metab. 2020. PMID: 32069353 Free PMC article. Clinical Trial.
-
Association of the pattern recognition molecule H-ficolin with incident microalbuminuria in an inception cohort of newly diagnosed type 1 diabetic patients: an 18 year follow-up study.Diabetologia. 2014 Oct;57(10):2201-7. doi: 10.1007/s00125-014-3332-7. Epub 2014 Jul 28. Diabetologia. 2014. PMID: 25064124
References
-
- Duhault J, Koenig-Berard E. Therapie. 1997;52:375–384. - PubMed
-
- Nathan D M. Ann Intern Med. 1996;124:86–89. - PubMed
-
- Brownlee M, Vlassara H, Cerami A. Ann Intern Med. 1984;101:527–537. - PubMed
-
- McDonald M J, Bleichman M, Bunn H F. J Biol Chem. 1979;254:702–707. - PubMed
-
- Ceriello A, Giugliano D, Quatraro A, Stante A, Consoli G, Dello Russo P, D'Onofrio F. Diabete Metab. 1987;13:16–19. - PubMed
Publication types
MeSH terms
Substances
Grants and funding
LinkOut - more resources
Full Text Sources
Other Literature Sources
Molecular Biology Databases
Research Materials
Miscellaneous
