. 2000 May 9;97(10):5462-7.
doi: 10.1073/pnas.97.10.5462.

AIS is an oncogene amplified in squamous cell carcinoma

Affiliations

AIS is an oncogene amplified in squamous cell carcinoma

K Hibi et al. Proc Natl Acad Sci U S A. .

Abstract

We and others recently isolated a human p53 homologue (p40/p51/p63/p73L) and localized the gene to the distal long arm of chromosome 3. Here we sought to examine the role of p40/p73L, two variants lacking the N-terminal transactivation domain, in cancer. Fluorescent in situ hybridization (FISH) analysis revealed frequent amplification of this gene locus in primary squamous cell carcinoma of the lung and head and neck cancer cell lines. (We named this locus AIS for amplified in squamous cell carcinoma.) Furthermore, amplification of the AIS locus was accompanied by RNA and protein overexpression of a variant p68(AIS) lacking the terminal transactivation domain. Protein overexpression in primary lung tumors was limited to squamous cell carcinoma and tumors known to harbor a high frequency of p53 mutations. Overexpression of p40(AIS) in Rat 1a cells led to an increase in soft agar growth and tumor size in mice. Our results support the idea that AIS plays an oncogenic role in human cancer.


Figures

Figure 1
Figure 1
The recent cloning of these variants by several groups (–10, 29) has led to a potentially confusing nomenclature. Because this gene locus is amplified in squamous cell carcinoma, we renamed the gene AIS, with further designations of splice variants as listed above based on their predicted molecular weight. Note that p68AIS (p73L) described here is ΔNp63α/CUSP and not p73 encoded on chromosome 1.
Figure 2
Figure 2
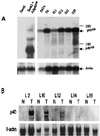
Detection of AIS expression by Northern analysis. (A) AIS transcripts in HNSCC cell lines and lung cancer cell lines. AIS expression is observed in all HNSCC cell lines, whereas no expression is observed in the SaOs2 cell line. A human β-actin probe was used as an internal control. (B) Samples (10 μg) of total RNA extracted from tumor (T) and normal (N) tissues of five different patients with primary lung cancers were hybridized with a 32P-labeled probe for AIS or β-actin. AIS expression of various intensities is observed in the tumor RNA of patients L2, L10, and L12 but is absent from all normal tissue controls.
Figure 3
Figure 3
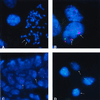
Detection of AIS gene amplification by FISH analysis. (A) Low AIS gene amplification [bacterial artificial chromosome (BAC) probe, red] was observed on metaphase and interphase nuclei of the HNSCC cell line (FaDu) compared with a chromosome 3 centromeric probe (green). FaDu is known to have an abnormal chromosome 3 karyotype; der(3)t(3:8)(q21:q?). Six signals from the BAC probe were seen on the telomeric end of the long arm of chromosome 3 and on the short arm of chromosome 3 compared with four signals from the chromosome 3 centromeric probe. As a control, normal lymphocytes were subjected to the same FISH analysis to confirm that the BAC probe had no cross-hybridization with other chromosomal regions. (B) High AIS gene amplification (red, 5-fold) was observed on interphase nuclei of the HNSCC cell line 011 compared with a chromosome 3 centromeric probe (green). (C) A primary squamous cell lung carcinoma (T21) showing two centromeric signals (green) and six to eight AIS signals (red) per tumor cell. The number of signals in each cell may vary depending on the focus of the microscope. (D) Control hybridization on isolated nuclei preparation from normal bronchial epithelium showing most of the cells with two signals of both chromosome 3 (green) and AIS signals (red) (arrows).
Figure 4
Figure 4
Expression of AIS in HNSCC cell lines. One hundred micrograms of protein extract was subjected to SDS/10% PAGE followed by Western blot analysis as described (12). The antibodies used for probing the blots are indicated on the right and the molecular mass markers are indicated on the left sides of the gels. (A) Western blot analysis of HNSCC cell line 022 (lane 1) and SaOs2 cell line expressing p68AIS and p40AIS, respectively (lane 2). (B) Western blot analysis of various HNSCC cell lines. Lanes: 1, 293; 2, FaDu; 3, 029; 4, 022; 5, 012; and 6, 011. A specific band below 75 kDa is observed in all HNSCC cell lines.
Figure 5
Figure 5
AIS protein immunoreactivity in squamous cell carcinoma of the lung (T1). Nests of infiltrating tumor cells demonstrate intense nuclear staining (arrows) after incubation with a polyclonal antibody with absence of expression in surrounding normal cells. This tumor had genomic amplification of AIS and a p53 mutation (Table 2). (×200.)
Figure 6
Figure 6
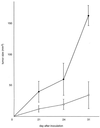
Tumor growth in nude mice. Rat 1a-p40AIS cells (●) developed into significantly larger tumors compared with Rat 1a-no (○) cells at day 21 (P = 0.0218, t test), day 24 (P = 0.0265), and day 31 (P < 0.0001). Each curve represents the mean (±SD) volume of four tumors as shown. On day 31, Rat 1a-p40AIS tumors averaged 162.8 ± 14.8 mm3, whereas Rat 1a-no tumors averaged 35.0 ± 21.8 mm3.

Similar articles

Cited by

References

    1. Hollstein M, Sidransky D, Vogelstein B, Harris C. Science. 1991;253:49–53. - PubMed
    1. Sidransky D, Frost P, Von Eschenbach A, Oyasu R, Preisinger A C, Vogelstein B. New Engl J Med. 1992;326:737–740. - PubMed
    1. Mao L, Sidransky D. Hum Mol Genet. 1994;3:521. - PubMed
    1. Kaghad M, Bonnet H, Yang A, Creancier L, Biscan J-C, Valent A, Minty A, Chalon P, Lelias J-M, Dumont X, et al. Cell. 1997;90:809–819. - PubMed
    1. Gong J G, Costanzo A, Yang H Q, Melino G, Kaelin W G, Jr, Levrero M, Wang J Y. Nature (London) 1999;399:806–809. - PubMed

Publication types

MeSH terms