. 2000 May;123(1):111-24.
doi: 10.1104/pp.123.1.111.

Expression of water channel proteins in Mesembryanthemum crystallinum

Affiliations

Expression of water channel proteins in Mesembryanthemum crystallinum

H H Kirch et al. Plant Physiol. 2000 May.

Abstract

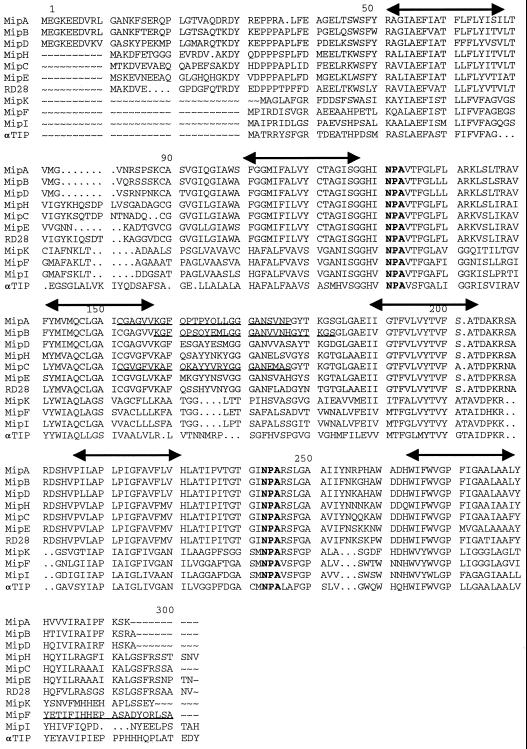
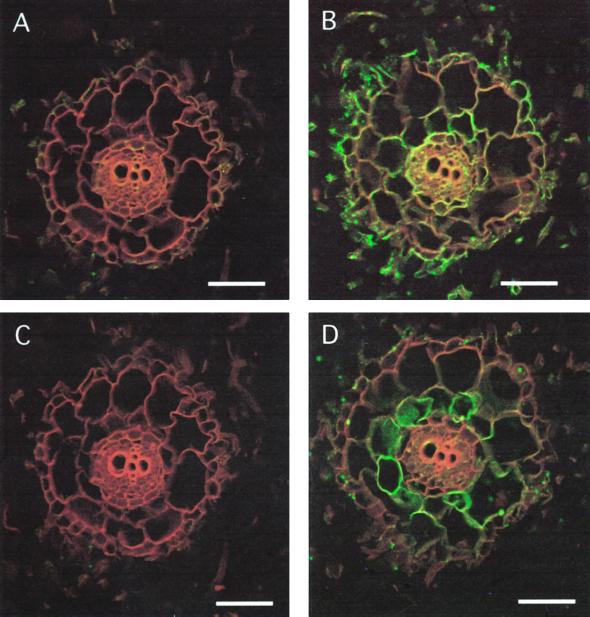
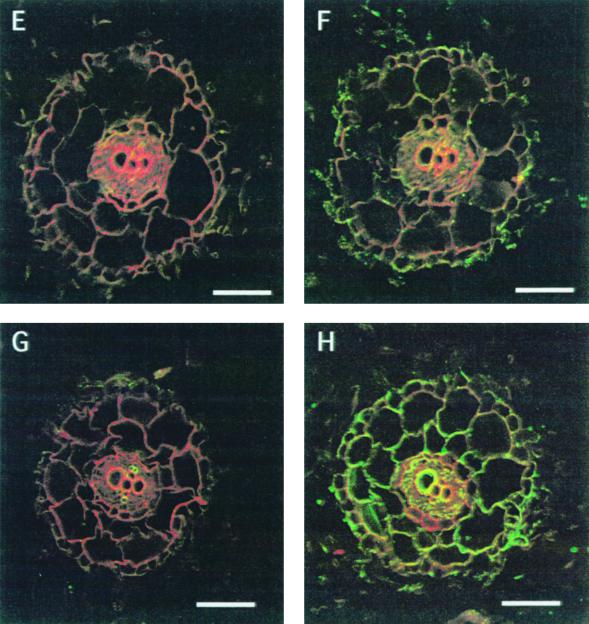
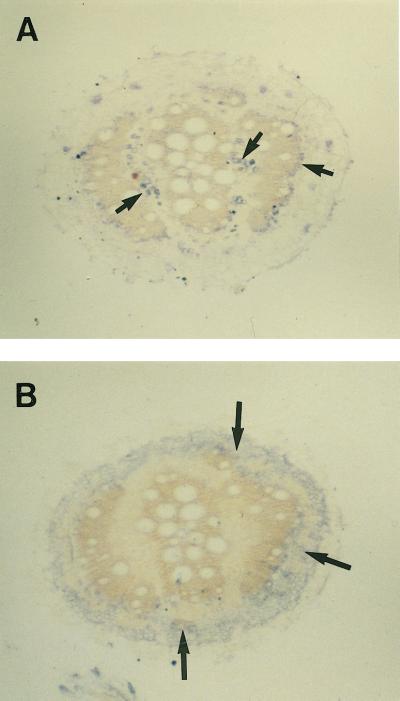
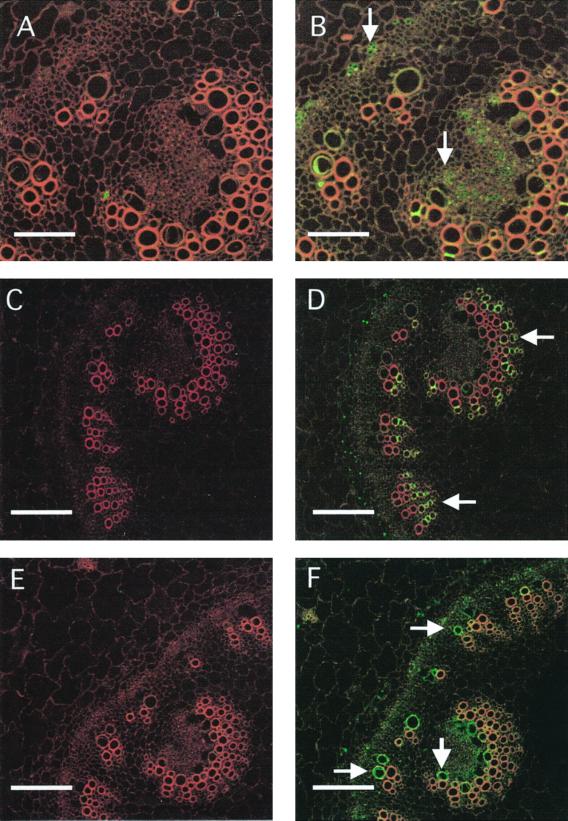
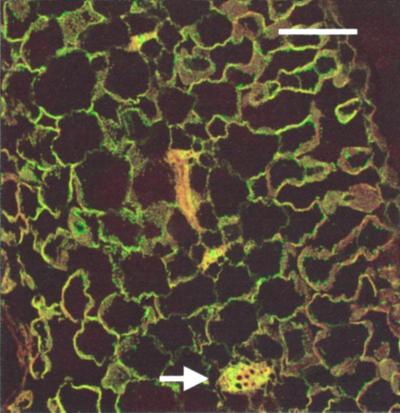
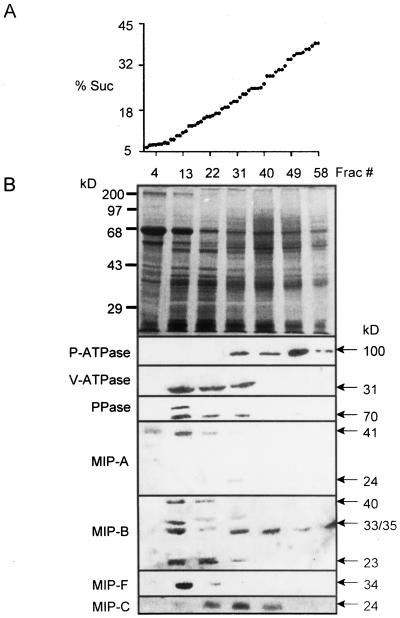
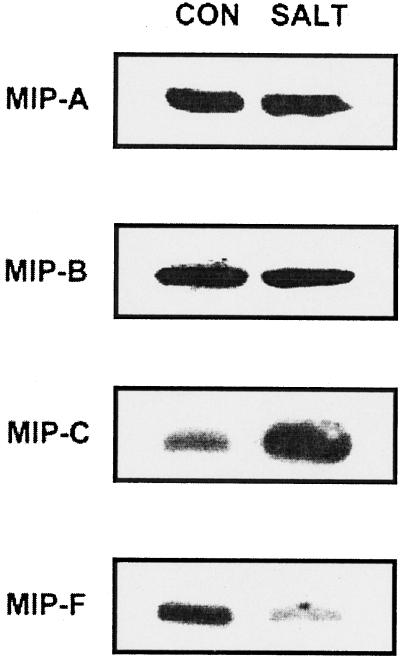
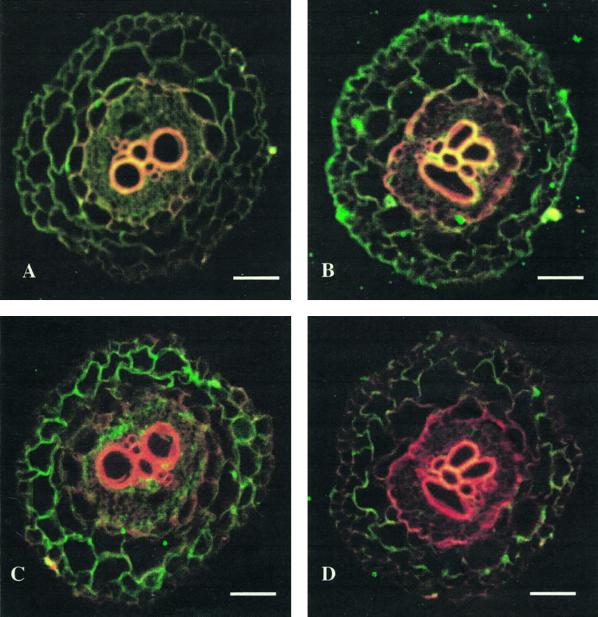
We have characterized transcripts for nine major intrinsic proteins (MIPs), some of which function as water channels (aquaporins), from the ice plant Mesembryanthemum crystallinum. To determine the cellular distribution and expression of these MIPs, oligopeptide-based antibodies were generated against MIP-A, MIP-B, MIP-C, or MIP-F, which, according to sequence and functional characteristics, are located in the plasma membrane (PM) and tonoplast, respectively. MIPs were most abundant in cells involved in bulk water flow and solute flux. The tonoplast MIP-F was found in all cells, while signature cell types identified different PM-MIPs: MIP-A predominantly in phloem-associated cells, MIP-B in xylem parenchyma, and MIP-C in the epidermis and endodermis of immature roots. Membrane protein analysis confirmed MIP-F as tonoplast located. MIP-A and MIP-B were found in tonoplast fractions and also in fractions distinct from either the tonoplast or PM. MIP-C was most abundant but not exclusive to PM fractions, where it is expected based on its sequence signature. We suggest that within the cell, MIPs are mobile, which is similar to aquaporins cycling through animal endosomes. MIP cycling and the differential regulation of these proteins observed under conditions of salt stress may be fundamental for the control of tissue water flux.


Figures

Figure 1
Figure 1
Deduced protein sequences of two authentic aquaporins (MIP-A and MIP-B) and seven putative PM- and tonoplast-MIPs from M. crystallinum are compared with Arabidopsis RD28 and bean α-TIP. Three of the nine sequences have been reported previously (Yamada et al., 1995; accession nos: MIP-A, L36095; MIP-B, L36097; MIP-C, U73466; MIP-D, U26537; MIP-E, U73467; MIP-F, U43291; MIP-H, AF133530;MIP-I, AF133531; and MIP-K,AF133532). Putative transmembrane regions are marked by double arrows above the sequences. The signature motifs (NPA) for aquaporins are shown in bold. Sequences used for oligopeptide synthesis are underlined. Cys residues were added to the amino termini of MIP-F oligopeptides. Cys were acetylated for conjugation to agarose prior to affinity purification of the crude serum. The other oligopeptides utilized a Cys that was present in the sequences.
Figure 2
Figure 2
Immunolocalization of MIP-A, MIP-B, MIP-C, and MIP-F in immature roots of M. crystallinum. Fixed cross-sections (8–10 μm) of minor immature roots within 3 mm of the meristem were incubated with anti-MIP antibodies followed by goat anti-rabbit IgG coupled to Cy-5. Individual images for the emission of autofluorescence and for the Cy-5 fluorochrome were collected sequentially from the same optical section of the tissue, pseudocolored, and merged. Red/orange represents autofluorescence and green identifies MIP localization. Co-localization of the Cy-5 and tissue fluorescence is represented by yellow. The section shown in A and C was successively stained with MIP-A and MIP-B preimmune serum. A, C, E, and G represent images after staining with preimmune serum for MIP-A, MIP-B, MIP-C, and MIP-F, respectively. B, D, F, and H are stained with serum to MIP-A, MIP-B, MIP-C, and MIP-F, respectively. The bars represent 150 μm.
Figure 2
Figure 2
Immunolocalization of MIP-A, MIP-B, MIP-C, and MIP-F in immature roots of M. crystallinum. Fixed cross-sections (8–10 μm) of minor immature roots within 3 mm of the meristem were incubated with anti-MIP antibodies followed by goat anti-rabbit IgG coupled to Cy-5. Individual images for the emission of autofluorescence and for the Cy-5 fluorochrome were collected sequentially from the same optical section of the tissue, pseudocolored, and merged. Red/orange represents autofluorescence and green identifies MIP localization. Co-localization of the Cy-5 and tissue fluorescence is represented by yellow. The section shown in A and C was successively stained with MIP-A and MIP-B preimmune serum. A, C, E, and G represent images after staining with preimmune serum for MIP-A, MIP-B, MIP-C, and MIP-F, respectively. B, D, F, and H are stained with serum to MIP-A, MIP-B, MIP-C, and MIP-F, respectively. The bars represent 150 μm.
Figure 3
Figure 3
MIP-A (A) and MIP-F (B) antibodies show differential localization in mature roots. Sections more than 10 cm from the root tip were incubated with anti-MIP antibodies followed by goat anti-rabbit IgG coupled to peroxidase. The signals reflecting the localization of the protein are seen as gray to bluish spots. A, Anti-MIP-A antibodies stain patches of phloem (small arrows) surrounding xylem rings that develop in the mature root. B, Anti-MIP-F antibodies stain a region surrounding the outermost xylem ring (large arrows) in the cortex of the root. The bars represent 500 μm.
Figure 4
Figure 4
Cell-specific expression of MIP-A, MIP-B, and MIP-F in stem sections. Fixed cross-sections (8–10 μm) of stems were used and treated as described in Figure 2. A, C, and E represent images after staining with preimmune serum for MIP-A, MIP-B, and MIP-F, respectively. B, D, and F are stained with serum against MIP-A, MIP-B, and MIP-F, respectively. Bars in A and B represent 70 μm, and in C through F, 150 μm. Arrows in B point to phloem elements, arrows in D to old xylem vessels and xylem parenchyma, and arrows in F to developing xylem vessels.
Figure 5
Figure 5
Low amounts of MIP-F were detected in mesophyll cells. Staining of mesophyll cells in a mature leaf treated as described in Figure 2 appears weaker than staining of vascular tissues visible as minor veins (arrow). The bar represents 70 μm.
Figure 6
Figure 6
Localization of MIPs in membrane fractions separated by continuous Suc density gradient centrifugation. A, Suc concentrations in collected fractions show linearity of the gradient. B, Membrane protein profile from M. crystallinum cell suspensions of selected fractions on Coomassie Blue-stained gels (12.5% [w/v] acrylamide) and immunological detection in the respective fractions of (from top to bottom) P-ATPase, V-ATPase, V-PPase, MIP-A, MIP-B, and MIP-F (in membrane protein isolated from cell suspensions) and MIP-C (in membrane protein isolated from roots). Molecular masses of bands are indicated.
Figure 7
Figure 7
Western-blot analysis of the effect of salt-stress on levels of MIP polypeptides in purified root or leaf PM or tonoplast. PM (MIP-B, 33-kD polypeptide; MIP-C, 24-kD polypeptide) or tonoplast (MIP-A, 41-kD polypeptide; MIP–F, 34-kD polypeptide) purified from leaves (MIP-A, MIP-B, or MIP-F) or roots (MIP-C) of M. crystallinum. CON, Control (in the absence of stress); SALT, plants treated with 200 mm NaCl for 2 weeks. Plant age (6 weeks) was identical under control and stress conditions.
Figure 8
Figure 8
Cell-specific changes in MIP-A and MIP-F following salt stress in M. crystallinum immature roots. Immunocytological analysis of MIP-A (A and B) and MIP-F (C and D) indicated persistence of the MIP-A signal following salt stress (B), while the signal for MIP-F declined (D). Root tips were obtained from plants grown in hydroponic culture 3 d after the addition of 400 mm NaCl, and sections were prepared as described in Figure 2. A and C, Untreated control roots for MIP-A and MIP-F, respectively. The bars represent 70 μm.

Similar articles

Cited by

References

    1. Abrami L, Capurro C, Ibarra C, Parisi M, Buhler JM, Ripoche P. Distribution of mRNA encoding the FA-CHIP water channel in amphibian tissues: effects of salt adaptation. J Membr Biol. 1995;143:199–205. - PubMed
    1. Adams P, Nelson DE, Yamada S, Chmara W, Jensen RG, Bohnert HJ, Griffiths H. Growth and development of Mesembryanthemum crystallinum (Aizoaceae) New Phytol. 1998;138:171–190. - PubMed
    1. Agre P, Bonhivers M, Borgnia MJ. The aquaporins, blueprints for cellular plumbing systems. J Biol Chem. 1998;273:14659–14662. - PubMed
    1. Barkla BJ, Blumwald E. Identification of a 170-kDa protein associated with the vacuolar Na+/H+-antiport of Beta vulgaris. Proc Natl Acad Sci USA. 1991;88:11177–11181. - PMC - PubMed
    1. Barkla BJ, Vera-Estrella R, Kirch HH, Pantoja O, Bohnert HJ. Aquaporin localization: how valid are the TIP and PIP labels? Trends Plant Sci. 1999;4:86–88. - PubMed

Publication types

LinkOut - more resources