

Internal conductance to CO(2) diffusion and C(18)OO discrimination in C(3) leaves
- PMID: 10806237
- PMCID: PMC58994
- DOI: 10.1104/pp.123.1.201
Internal conductance to CO(2) diffusion and C(18)OO discrimination in C(3) leaves
Abstract
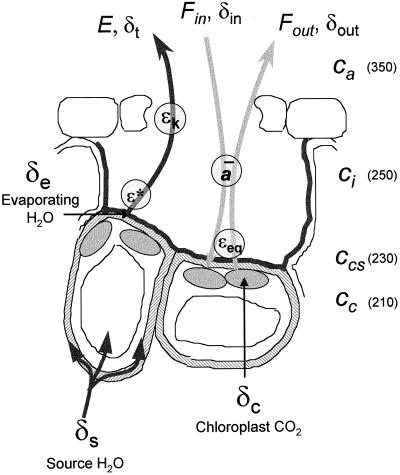
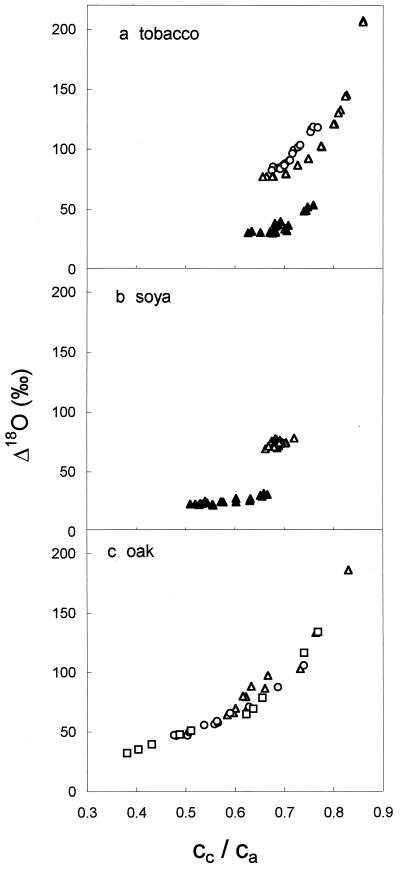
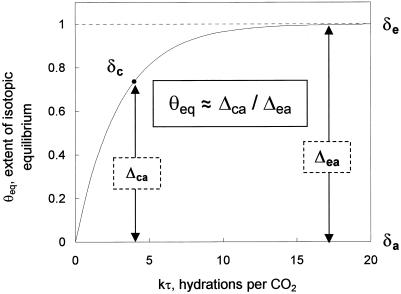
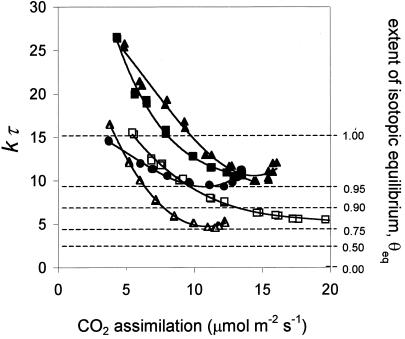
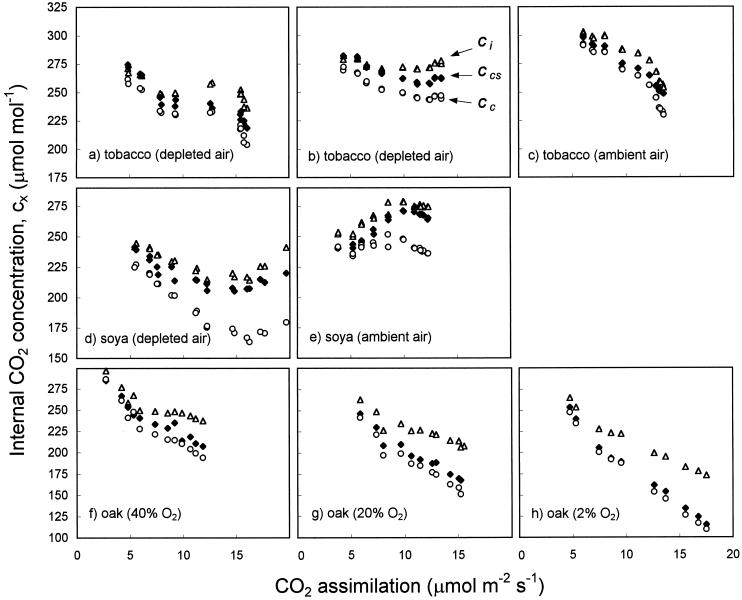
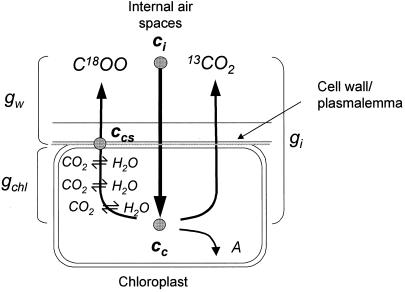
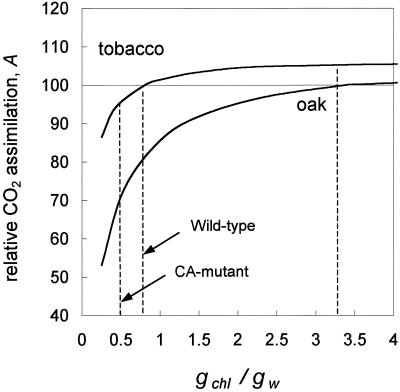
(18)O discrimination in CO(2) stems from the oxygen exchange between (18)O-enriched water and CO(2) in the chloroplast, a process catalyzed by carbonic anhydrase (CA). A proportion of this (18)O-labeled CO(2) escapes back to the atmosphere, resulting in an effective discrimination against C(18)OO during photosynthesis (Delta(18)O). By constraining the delta(18)O of chloroplast water (delta(e)) by analysis of transpired water and the extent of CO(2)-H(2)O isotopic equilibrium (theta(eq)) by measurements of CA activity (theta(eq) = 0.75-1.0 for tobacco, soybean, and oak), we could apply measured Delta(18)O in a leaf cuvette attached to a mass spectrometer to derive the CO(2) concentration at the physical limit of CA activity, i.e. the chloroplast surface (c(cs)). From the CO(2) drawdown sequence between stomatal cavities from gas exchange (c(i)), from Delta(18)O (c(cs)), and at Rubisco sites from Delta(13)C (c(c)), the internal CO(2) conductance (g(i)) was partitioned into cell wall (g(w)) and chloroplast (g(ch)) components. The results indicated that g(ch) is variable (0.42-1.13 mol m(-2) s(-1)) and proportional to CA activity. We suggest that the influence of CA activity on the CO(2) assimilation rate should be important mainly in plants with low internal conductances.
Figures
Similar articles
-
A transgenic approach to understanding the influence of carbonic anhydrase on C18OO discrimination during C4 photosynthesis.Plant Physiol. 2006 Oct;142(2):662-72. doi: 10.1104/pp.106.085167. Epub 2006 Aug 11. Plant Physiol. 2006. PMID: 16905667 Free PMC article.
-
Role of mesophyll diffusion conductance in constraining potential photosynthetic productivity in the field.J Exp Bot. 2009;60(8):2249-70. doi: 10.1093/jxb/erp036. Epub 2009 Apr 23. J Exp Bot. 2009. PMID: 19395391 Review.
-
A new measurement technique reveals temporal variation in delta18O of leaf-respired CO2.Plant Cell Environ. 2007 Apr;30(4):456-68. doi: 10.1111/j.1365-3040.2007.01633.x. Plant Cell Environ. 2007. PMID: 17324232
-
Spatial variation in photosynthetic CO(2) carbon and oxygen isotope discrimination along leaves of the monocot triticale (Triticum × Secale) relates to mesophyll conductance and the Péclet effect.Plant Cell Environ. 2011 Sep;34(9):1548-62. doi: 10.1111/j.1365-3040.2011.02352.x. Epub 2011 Jun 28. Plant Cell Environ. 2011. PMID: 21707646
-
Mesophyll conductance to CO2: current knowledge and future prospects.Plant Cell Environ. 2008 May;31(5):602-21. doi: 10.1111/j.1365-3040.2007.01757.x. Epub 2007 Nov 7. Plant Cell Environ. 2008. PMID: 17996013 Review.
Cited by
-
A transgenic approach to understanding the influence of carbonic anhydrase on C18OO discrimination during C4 photosynthesis.Plant Physiol. 2006 Oct;142(2):662-72. doi: 10.1104/pp.106.085167. Epub 2006 Aug 11. Plant Physiol. 2006. PMID: 16905667 Free PMC article.
-
The response of mesophyll conductance to short-term variation in CO2 in the C4 plants Setaria viridis and Zea mays.J Exp Bot. 2018 Feb 23;69(5):1159-1170. doi: 10.1093/jxb/erx464. J Exp Bot. 2018. PMID: 29474683 Free PMC article.
-
Function of Nicotiana tabacum aquaporins as chloroplast gas pores challenges the concept of membrane CO2 permeability.Plant Cell. 2008 Mar;20(3):648-57. doi: 10.1105/tpc.107.054023. Epub 2008 Mar 18. Plant Cell. 2008. PMID: 18349152 Free PMC article.
-
Temporal variability in (13)C of respired CO(2) in a pine and a hardwood forest subject to similar climatic conditions.Oecologia. 2005 Jan;142(1):57-69. doi: 10.1007/s00442-004-1692-2. Epub 2004 Aug 31. Oecologia. 2005. PMID: 15340829
-
The role of phosphoenolpyruvate carboxylase during C4 photosynthetic isotope exchange and stomatal conductance.Plant Physiol. 2007 Nov;145(3):1006-17. doi: 10.1104/pp.107.103390. Epub 2007 Sep 7. Plant Physiol. 2007. PMID: 17827274 Free PMC article.
References
-
- Anderson LE, Gibbons JT, Wang X. Distribution of ten enzymes of carbon metabolism in pea (Pisum sativum) Int J Plant Sci. 1996;157:525–538.
-
- Buhay WM, Edwards TWD, Aravena R. Evaluating kinetic fractionation factors use for ecologic and paleoclimatic reconstruction from oxygen and hydrogen isotope ratios in plant water and cellulose. Geochim Cosmochim Acta. 1996;60:2209–2218.
-
- Ciais P, Denning AS, Tans PP, A BJ, Randall DA, Collatz GJ, Sellers PJ, White JWC, Trolier M, Meijer HAJ, Francey RJ, Monfray P, Heimann M. A three dimensional synthesis study of δ18O in atmospheric CO2. Part 1: Surface fluxes. J Geophy Res. 1997;102:5873–5883.
-
- Cowan IR. Economics of carbon fixation in higher plants. In: Givnish TJ, editor. On the Economy of Plant Form and Function. Cambridge, UK: Cambridge University Press; 1986. pp. 133–170.
-
- Craig H, Gordon HI. Deuterium and oxygen-18 variations in the ocean and marine atmoshpere. In: Tongiorgi E, editor. Proceedings of a Conference on Stable Isotopes in Oceanographic Studies and Palaeotemperatures. Laboratory of Geology and Nuclear Science, Pisa. 1965. pp. 9–130.
Publication types
MeSH terms
Substances
LinkOut - more resources
Full Text Sources
Other Literature Sources
Miscellaneous
