

Expression of spinach ascorbate peroxidase isoenzymes in response to oxidative stresses
- PMID: 10806239
- PMCID: PMC58996
- DOI: 10.1104/pp.123.1.223
Expression of spinach ascorbate peroxidase isoenzymes in response to oxidative stresses
Abstract
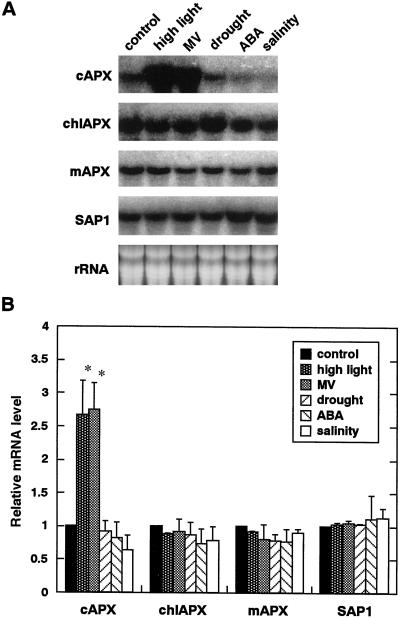
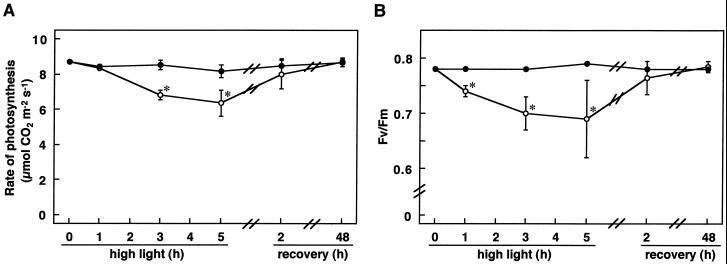
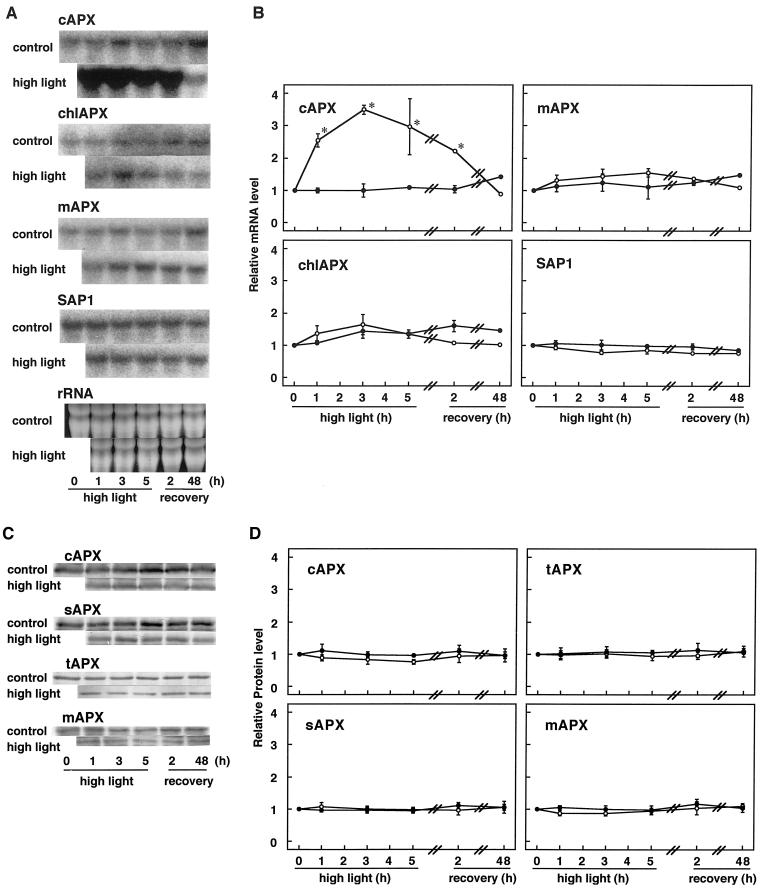
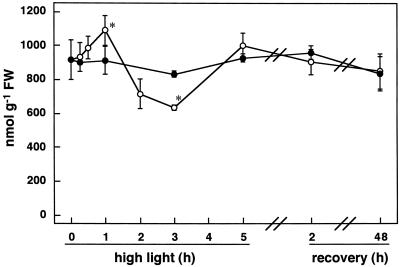
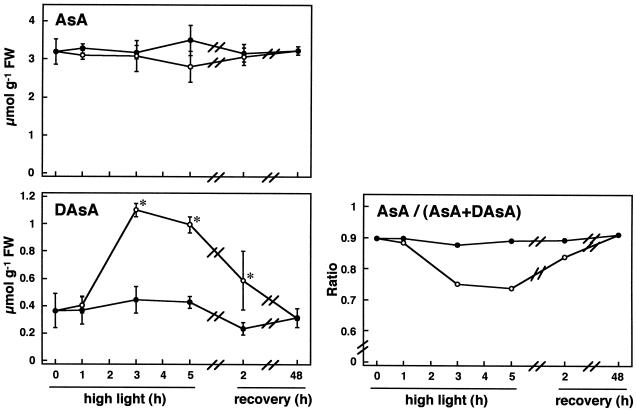
We studied the response of each ascorbate peroxidase (APX) isoenzyme in spinach leaves under stress conditions imposed by high light intensity, drought, salinity, and applications of methyl viologen and abscisic acid. The steady-state transcript level of cytosolic APX remarkably increased in response to high-light stress and methyl viologen treatment, but not in response to the other stress treatments. The transcript levels of the chloroplastic (stromal and thylakoid-bound) and microbody-bound APX isoenzymes were not changed in response to any of the stress treatments. To explore the responses of the APX isoenzymes to photooxidative stress, the levels of transcript and protein and activities of each isoenzyme were studied during high-light stress and following its recovery. The cytosolic APX activity increased in parallel with transcript abundance during high-light stress, while the protein level was not altered. The other isoenzymes showed no significant changes in transcript and protein levels and activities, except for the gradual decrease in chloroplastic isoenzyme activities.
Figures
Similar articles
-
Chloroplastic ascorbate peroxidase is the primary target of methylviologen-induced photooxidative stress in spinach leaves: its relevance to monodehydroascorbate radical detected with in vivo ESR.Biochim Biophys Acta. 2001 Apr 2;1504(2-3):275-87. doi: 10.1016/s0005-2728(00)00256-5. Biochim Biophys Acta. 2001. PMID: 11245791
-
Alternatively spliced mRNA variants of chloroplast ascorbate peroxidase isoenzymes in spinach leaves.Biochem J. 1999 Feb 15;338 ( Pt 1)(Pt 1):41-8. Biochem J. 1999. PMID: 9931296 Free PMC article.
-
Alternative mRNA splicing of 3'-terminal exons generates ascorbate peroxidase isoenzymes in spinach (Spinacia oleracea) chloroplasts.Biochem J. 1997 Dec 15;328 ( Pt 3)(Pt 3):795-800. doi: 10.1042/bj3280795. Biochem J. 1997. PMID: 9396722 Free PMC article.
-
Recent advances in ascorbate biosynthesis and the physiological significance of ascorbate peroxidase in photosynthesizing organisms.Biosci Biotechnol Biochem. 2008 May;72(5):1143-54. doi: 10.1271/bbb.80062. Epub 2008 May 7. Biosci Biotechnol Biochem. 2008. PMID: 18460785 Review.
-
Regulation and function of ascorbate peroxidase isoenzymes.J Exp Bot. 2002 May;53(372):1305-19. J Exp Bot. 2002. PMID: 11997377 Review.
Cited by
-
H2O2-triggered retrograde signaling from chloroplasts to nucleus plays specific role in response to stress.J Biol Chem. 2012 Apr 6;287(15):11717-29. doi: 10.1074/jbc.M111.292847. Epub 2012 Feb 9. J Biol Chem. 2012. PMID: 22334687 Free PMC article.
-
Cloning, expression and physiological analysis of broccoli catalase gene and Chinese cabbage ascorbate peroxidase gene under heat stress.Plant Cell Rep. 2010 Jun;29(6):575-93. doi: 10.1007/s00299-010-0846-4. Epub 2010 Mar 30. Plant Cell Rep. 2010. PMID: 20352229
-
A novel thylakoid ascorbate peroxidase from Jatrophacurcas enhances salt tolerance in transgenic tobacco.Int J Mol Sci. 2013 Dec 24;15(1):171-85. doi: 10.3390/ijms15010171. Int J Mol Sci. 2013. PMID: 24368517 Free PMC article.
-
The acclimation response to high light is initiated within seconds as indicated by upregulation of AP2/ERF transcription factor network in Arabidopsis thaliana.Plant Signal Behav. 2014;9(10):976479. doi: 10.4161/15592324.2014.976479. Plant Signal Behav. 2014. PMID: 25482793 Free PMC article.
-
Cold tolerance in thiourea primed capsicum seedlings is associated with transcript regulation of stress responsive genes.Mol Biol Rep. 2012 Dec;39(12):10603-13. doi: 10.1007/s11033-012-1948-6. Epub 2012 Oct 9. Mol Biol Rep. 2012. PMID: 23053959
References
-
- Allen RD, Webb RP, Schake SA. Use of transgenic plants to study antioxidant defenses. Free Radic Biol Med. 1997;23:473–479. - PubMed
-
- Amako K, Chen G-X, Asada K. Separate assays specific for ascorbate peroxidase and guaiacol peroxidase and for the chloroplastic and cytosolic isozymes of ascorbate peroxidase in plants. Plant Cell Physiol. 1994;35:497–504.
-
- Asada K. Ascorbate peroxidase: a hydrogen peroxide-scavenging enzyme in plants. Physiol Plant. 1992;85:235–241.
-
- Asada K. The role of ascorbate peroxidase and monodehydroascorbate reductase in H2O2 scavenging in plants. In: Scandalios JG, editor. Oxidative Stress and the Molecular Biology of Antioxidant Defenses. Cold Spring Harbor, NY: Cold Spring Harbor Laboratory Press; 1997. pp. 715–735.
-
- Bradford MM. A rapid and sensitive method for the quantitation of micro quantities of protein utilizing the principle of protein-dye binding. Anal Biochem. 1976;72:248–254. - PubMed
Publication types
MeSH terms
Substances
LinkOut - more resources
Full Text Sources
Other Literature Sources
Miscellaneous
