Comparative Study
. 2000 May;10(5):691-702.
doi: 10.1101/gr.10.5.691.

A radiation hybrid map of the cat genome: implications for comparative mapping

Affiliations
Comparative Study

A radiation hybrid map of the cat genome: implications for comparative mapping

W J Murphy et al. Genome Res. 2000 May.

Abstract

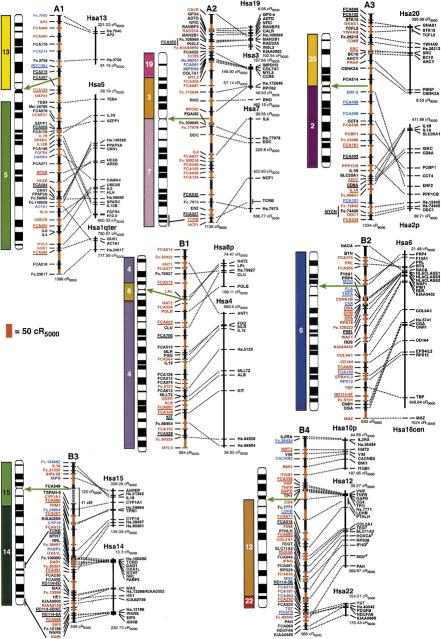
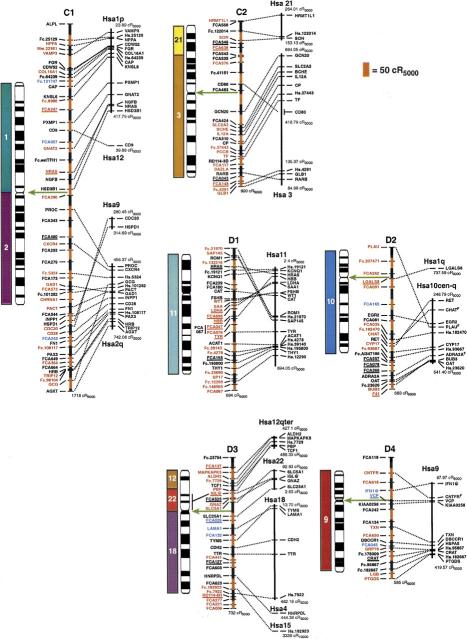
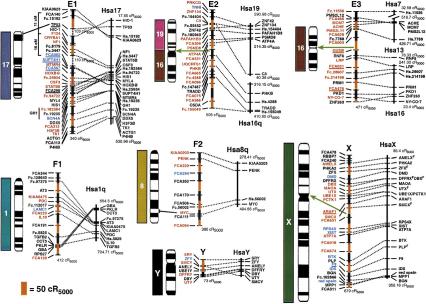
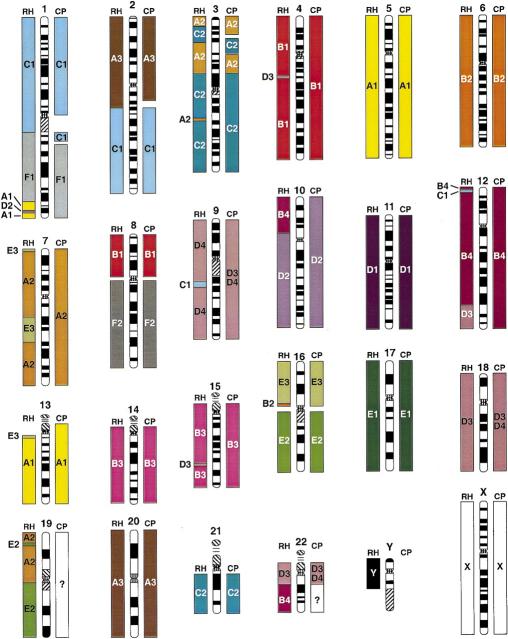
Ordered gene maps of mammalian species are becoming increasingly valued in assigning gene variants to function in human and animal models, as well as recapitulating the natural history of genome organization. To extend this power to the domestic cat, a radiation hybrid (RH) map of the cat was constructed integrating 424 Type I-coding genes with 176 microsatellite markers, providing coverage over all 20 feline chromosomes. Alignment of parallel RH maps of human and cat reveal 100 conserved segments ordered (CSOs) between the species, nearly three times the number observed with reciprocal chromosome painting analyses. The observed number is equivalent to theoretical predictions of the number of conserved segments to be found between cat and human, implying that 300-400 Type I gene markers is sufficient to reveal nearly all conserved segments for species that exhibit the most frequently observed "slow" rate of genome reorganization. The cat-human RH map comparisons provide a new genomic tool for comparative gene mapping in the cat and related Felidae, and provide confirmation that the cat genome organization is remarkably conserved compared with human. These data demonstrate that ordered RH-based gene maps provide the most precise assessment of comparing genomes, short of contig construction or full-sequence determination.


Figures

Figure 1
Figure 1
(See pages 693–695.) RH map of the domestic cat and human RH comparative map. Ideograms for each cat chromosome (Cho et al. 1997d) are shown to the left of each map. Hybridization results from human on cat chromosome painting (Rettenberger et al. 1995; Wienberg et al. 1997) are depicted to the left of each ideogram for comparison to the RH-derived syntenies. The extent of RH-based physical coverage of each chromosome is not implied, except where indicated by cytogenetic localization of Type I markers on the RH map (Cho et al. 1997a–c, 1998; Lee and Cho 1999). Orientation of RH maps relative to the chromosome is established except for the following chromosomes: D1, E3, F1, and Y. Green arrows indicate the inferred position of the centromere on the RH map, as determined by maximum retention frequency-based centromeric effects and syntenic boundaries. Loci labeled in red were ordered at odds ≥1000:1, those in blue ⩾100:1, those in black <100:1. The distances on the cat RH map are represented by alternating black and red vertical bars, with each bar corresponding to 50 cR5000. The length of each feline RH linkage group is listed below each map. The human RH maps are shown on the right. RH coordinates for the outermost markers of each human conserved homology block are listed. Human loci positioned on the Stanford G3-based RH map are depicted by a bar spanning the range of the same map interval in the Genebridge-4-based RH map (see Methods). Human ESTs that have not been associated with a named gene of known function are listed by their UniGene cluster identifier. Feline homologs of these loci are indicated by the prefix Fc. preceding the human cluster identifier number. The majority of feline microsatellites are denoted by the prefix FCA or an F, followed by a number (Menotti-Raymond et al. 1999). Broken lines connect homologous Type I loci in both cat and human RH maps. Gaps in the RH maps of B3 and E1 are connected by broken lines (no distance implied) and are bracketed by linked microsatellite loci in the genetic linkage map (Menotti-Raymond et al. 1999).
Figure 1
Figure 1
(See pages 693–695.) RH map of the domestic cat and human RH comparative map. Ideograms for each cat chromosome (Cho et al. 1997d) are shown to the left of each map. Hybridization results from human on cat chromosome painting (Rettenberger et al. 1995; Wienberg et al. 1997) are depicted to the left of each ideogram for comparison to the RH-derived syntenies. The extent of RH-based physical coverage of each chromosome is not implied, except where indicated by cytogenetic localization of Type I markers on the RH map (Cho et al. 1997a–c, 1998; Lee and Cho 1999). Orientation of RH maps relative to the chromosome is established except for the following chromosomes: D1, E3, F1, and Y. Green arrows indicate the inferred position of the centromere on the RH map, as determined by maximum retention frequency-based centromeric effects and syntenic boundaries. Loci labeled in red were ordered at odds ≥1000:1, those in blue ⩾100:1, those in black <100:1. The distances on the cat RH map are represented by alternating black and red vertical bars, with each bar corresponding to 50 cR5000. The length of each feline RH linkage group is listed below each map. The human RH maps are shown on the right. RH coordinates for the outermost markers of each human conserved homology block are listed. Human loci positioned on the Stanford G3-based RH map are depicted by a bar spanning the range of the same map interval in the Genebridge-4-based RH map (see Methods). Human ESTs that have not been associated with a named gene of known function are listed by their UniGene cluster identifier. Feline homologs of these loci are indicated by the prefix Fc. preceding the human cluster identifier number. The majority of feline microsatellites are denoted by the prefix FCA or an F, followed by a number (Menotti-Raymond et al. 1999). Broken lines connect homologous Type I loci in both cat and human RH maps. Gaps in the RH maps of B3 and E1 are connected by broken lines (no distance implied) and are bracketed by linked microsatellite loci in the genetic linkage map (Menotti-Raymond et al. 1999).
Figure 2
Figure 2
Comparison of feline gene mapping (RH) and chromosome painting (CP) identified conserved segments relative to human chromosomes. The width and placement of the bars is approximate on the basis of cytogenetic assignment of loci in the blocks or proximity of ESTs to assigned human loci in the human RH maps. The smaller blocks do not imply coverage on the chromosome, but rather the number of genes per block.

References

    1. Andersson L, Archibald A, Ashburner M, Audun S, Barendse W, Bitgood J, Bottema C, Broad T, Brown S, Burt D, et al. Comparative genome organization of vertebrates. The first international workshop on comparative genome organization. Mamm Genome. 1996;7:717–734. - PubMed
    1. Berg T, Tollersrud OK, Walkley SU, Siegel D, Nilssen O. Purification of feline lysosomal alpha-mannosidase, determination of its cDNA sequence and identification of a mutation causing alpha- mannosidosis in Persian cats. Biochem J. 1997;328:863–870. - PMC - PubMed
    1. Bielec PE, Gallagher DS, Womack JE, Busbee DL. Homologies between human and dolphin chromosomes detected by heterologous chromosome painting. Cytogenet Cell Genet. 1998;81:18–25. - PubMed
    1. Biller DS, DiBartola SP, Eaton KA, Pflueger S, Wellman ML, Radin MJ. Inheritance of polycystic kidney disease in Persian cats. J Hered. 1996;87:1–5. - PubMed
    1. Boehnke M, Lange K, Cox DR. Statistical methods for multipoint radiation hybrid mapping. Am J Hum Genet. 1991;49:1174–1188. - PMC - PubMed

Publication types

Associated data

LinkOut - more resources