

Review
doi: 10.1105/tpc.12.5.637.
Genome relationships: the grass model in current research
Affiliations
- PMID: 10810140
- PMCID: PMC139917
- DOI: 10.1105/tpc.12.5.637
Item in Clipboard
Review
Genome relationships: the grass model in current research
Plant Cell.
2000 May.
No abstract available
Figures
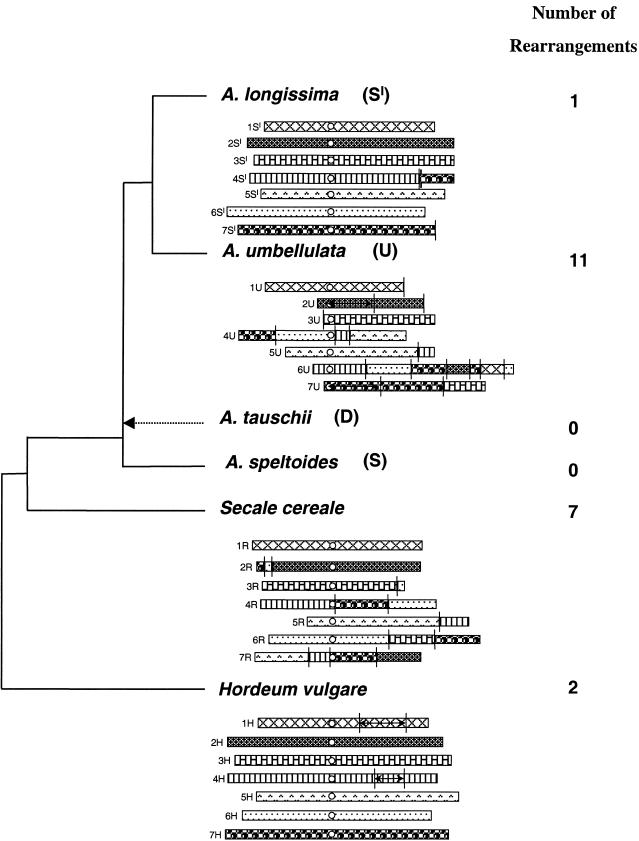
Phylogenetic and Genome Relationships among Six Triticeae Grasses. The D genome of A. tauschii has been chosen as the reference, and each of the seven chromosomes is represented by a different pattern. Open circles indicate centromere positions. Double-headed arrows indicate inversions. Vertical lines indicate evolutionary translocation breakpoints. The minimum number of chromosomal rearrangements necessary for the six present-day genomes to have evolved from the D genome format is given for each species.
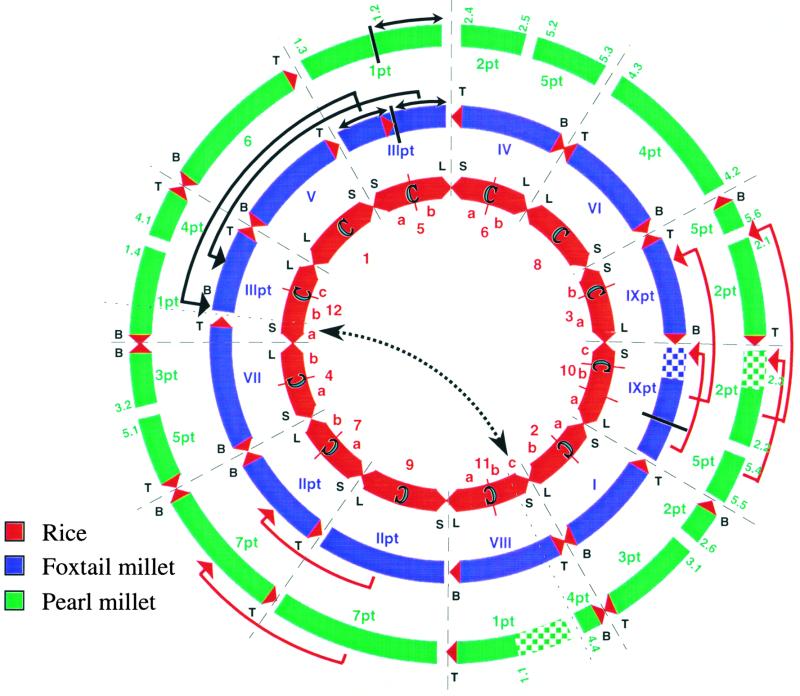
Relationships among the Genomes of Rice, Foxtail Millet, and Pearl Millet. C indicates rice centromere positions. Red triangles indicate telomeres. S and L indicate short and long arms, respectively, as assigned to the rice chromosomes, which are numbered with arabic numerals. Rice linkage blocks correspond to entire chromosomes (e.g., rice chromosomes 1, 8, and 9) or chromosome segments (e.g., 2a, 2b, 3a, and 3b). In foxtail and pearl millet, for which linkage groups have not been assigned to short and long arms, the designations top (T) and bottom (B), which correspond to the published maps (Devos et al., 1998, 2000), are used. Foxtail millet chromosomes are numbered with roman numerals, and pearl millet linkage groups are numbered with arabic numerals. For chromosomes that have orthology to more than one rice chromosome, segments are indicated with the chromosome number followed by pt (part). Hatched areas indicate regions for which few comparative data are available. Double-headed arrows show inversions; single-headed arrows denote evolutionary translocations. In pearl millet, due to the large number of rearrangements relative to rice, the majority of arrows are omitted. Rearrangements can be derived from the chromosome segment numbers; for example, pearl millet linkage group 5 is orthologous from top to bottom (T-5.1/5.2-5.3/5.4-5.5/5.6-B) with rice linkage blocks 4a/6b/10a/3b. Red arrows show evolutionary translocations that characterize all Panicoideae spp analyzed to date. The dotted arrow indicates the rice 11S/12S duplication. See the text for details.
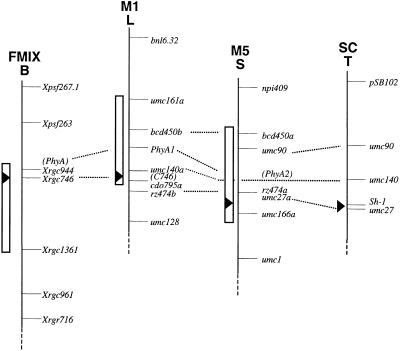
Orthologous Regions of Foxtail Millet, Maize, and Sorghum Chromosomes That Carry Genes Controlling Shattering of the Inflorescence. The chromosome regions shown are the bottom of foxtail millet IX (FMIX, B), the long arm of maize 1 (M1, L), the short arm of maize 5 (M5, S), and the top of sorghum C (SC, T), which have been shown to carry genes controlling shattering. Rectangles delineate the extent of the QTL, and solid triangles indicate the position at which the highest QTL effect was observed or, in the case of sorghum, the position of a mapped single gene, Sh-1. Maize maps are composite maps based on the data by Paterson et al. (1995) and Davis et al. (1999).
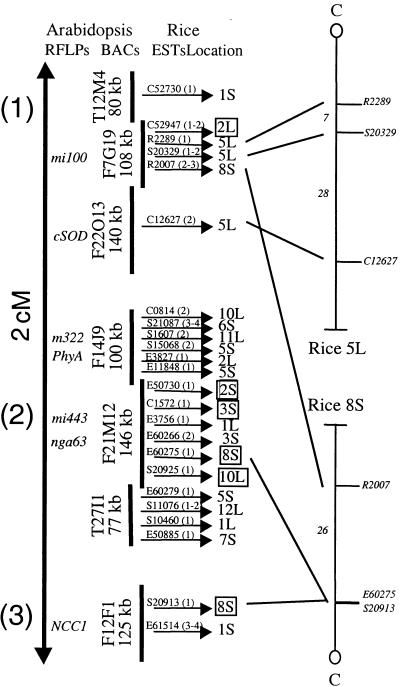
Syntenic Relationships between Arabidopsis Genes and Corresponding Rice ESTs. A genetic map of an ∼2-centimorgan (cM) region at the top of Arabidopsis chromosome 1 is aligned with seven Arabidopsis BACs organized in three contigs. Also shown are corresponding rice ESTs, their copy number, and map locations on rice chromosome arms 5L and 8S. For ESTs in which true homology between the rice EST and Arabidopsis gene has been established, the locations are shown in boxes. RFLP, restriction fragment length polymorphism.
References
-
- Büschges, R., et al. (1997). The barley Mlo gene: A novel control element of plant pathogen resistance. Cell 88, 695–705. - PubMed
-
- Chao, S., Sharp, P.J., Worland, A.J., Warham, E.J., Koebner, R.M.D., and Gale, M.D. (1989). RFLP-based genetic maps of wheat homoeologous group 7 chromosomes. Theor. Appl. Genet. 78, 495–504. - PubMed
-
- Devos, K.M., Atkinson, M.D., Chinoy, C.N., Harcourt, R.L., Koebner, R.M.D., Liu, C.J., Masojc, P., Xie, D.X., and Gale, M.D. (1993. a). Chromosomal rearrangements in the rye genome relative to that of wheat. Theor. Appl. Genet. 85, 673–680. - PubMed
Publication types
MeSH terms
LinkOut - more resources
Full Text Sources
Other Literature Sources
