. 2000 May;12(5):647-62.
doi: 10.1105/tpc.12.5.647.

Identification of the SAAT gene involved in strawberry flavor biogenesis by use of DNA microarrays

Affiliations

Identification of the SAAT gene involved in strawberry flavor biogenesis by use of DNA microarrays

A Aharoni et al. Plant Cell. 2000 May.

Abstract

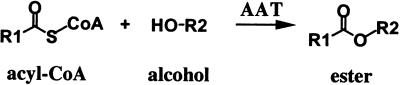
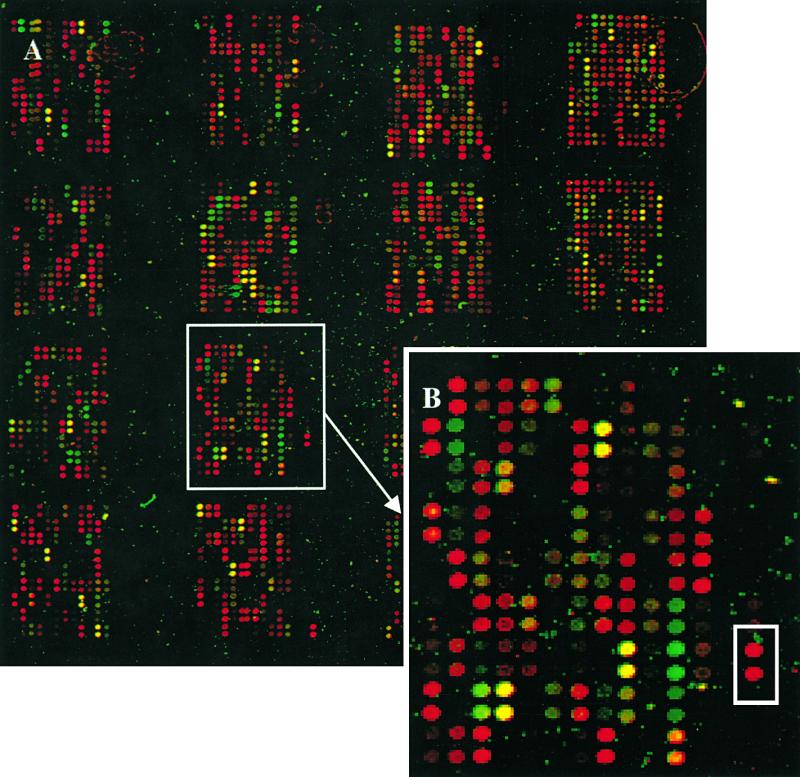
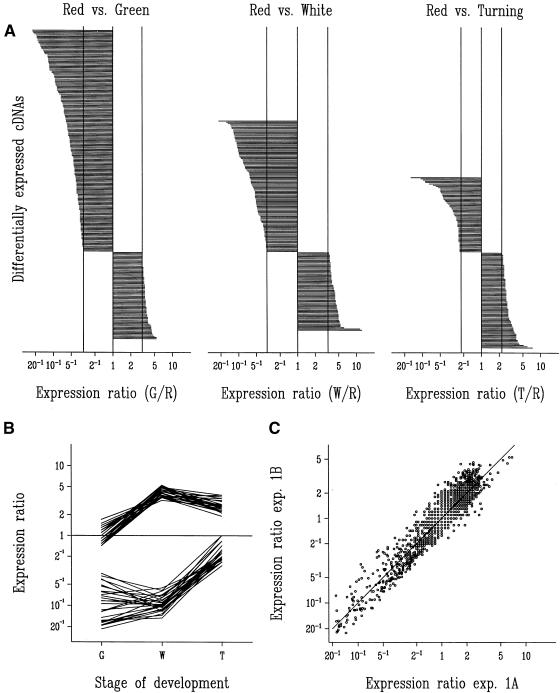
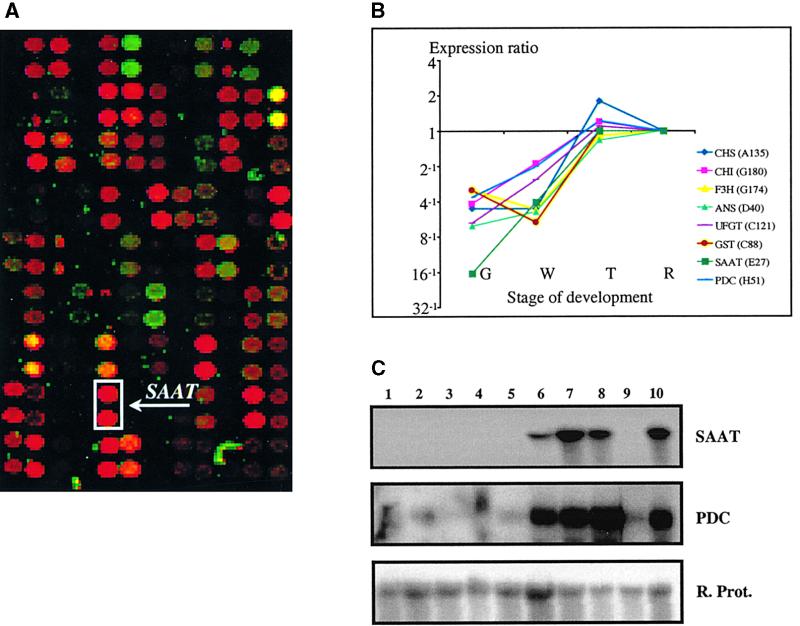
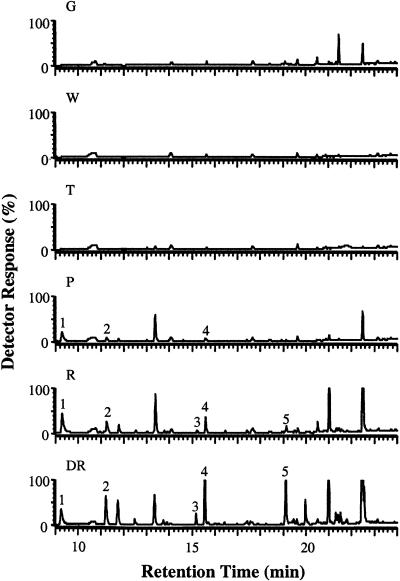
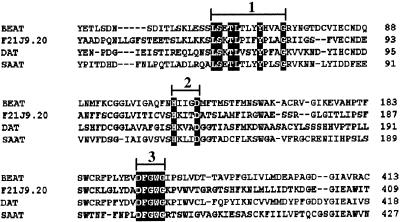
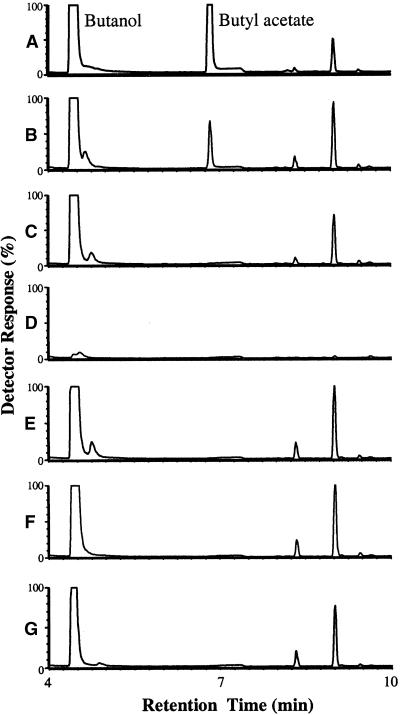
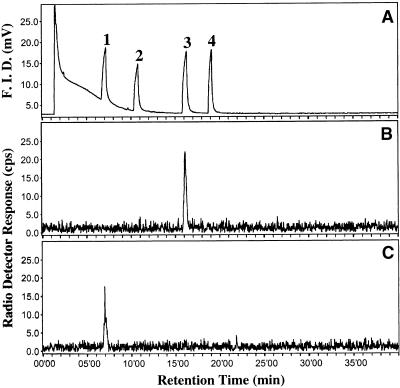
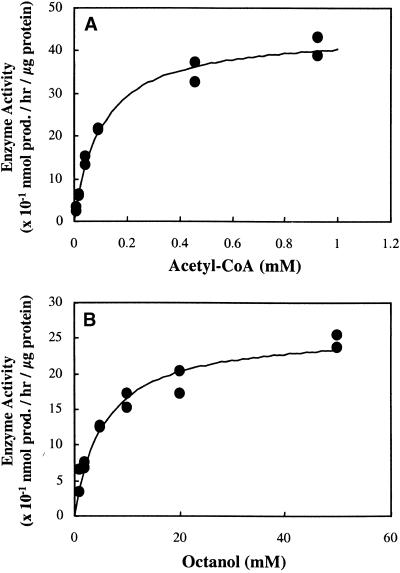
Fruit flavor is a result of a complex mixture of numerous compounds. The formation of these compounds is closely correlated with the metabolic changes occurring during fruit maturation. Here, we describe the use of DNA microarrays and appropriate statistical analyses to dissect a complex developmental process. In doing so, we have identified a novel strawberry alcohol acyltransferase (SAAT) gene that plays a crucial role in flavor biogenesis in ripening fruit. Volatile esters are quantitatively and qualitatively the most important compounds providing fruity odors. Biochemical evidence for involvement of the SAAT gene in formation of fruity esters is provided by characterizing the recombinant protein expressed in Escherichia coli. The SAAT enzyme showed maximum activity with aliphatic medium-chain alcohols, whose corresponding esters are major components of strawberry volatiles. The enzyme was capable of utilizing short- and medium-chain, branched, and aromatic acyl-CoA molecules as cosubstrates. The results suggest that the formation of volatile esters in fruit is subject to the availability of acyl-CoA molecules and alcohol substrates and is dictated by the temporal expression pattern of the SAAT gene(s) and substrate specificity of the SAAT enzyme(s).


Figures

Figure 1.
Figure 1.
General Scheme for the Esterification Reaction Catalyzed by AAT. The enzyme AAT catalyzes the transfer of an acyl moiety from acyl-CoA onto the corresponding alcohol, resulting in the formation of an ester.
Figure 2.
Figure 2.
Strawberry and Petunia cDNA Microarrays. (A) The strawberry and petunia cDNAs were spotted in a 4 × 4 format using a 16-pin print head. In each of the 16 subarrays, the first 12 columns from the left are strawberry probes (total of 1701, in duplicate), and the four columns from the right are petunia probes (total of 480, in duplicate). The array area is 17 × 17 mm. The image is a two-color overlay obtained with green-stage target (fluorescently labeled with Cy5) and red-stage target (fluorescently labeled with Cy3) cohybridized with a single microarray. In the superimposed image, the green-stage target is represented as a green signal and the red-stage target as a red signal. Signal intensities provide an estimate of expression levels, and the green or red spot colors correspond to higher transcript numbers in the green- or red-stage targets, respectively. Genes with no significant difference in expression between the two stages of development show an intermediate yellow or brown color. (B) Enlarged image of the subarray boxed in (A). Several petunia probes hybridized strongly with targets prepared with mRNA from strawberry at the red fruit stage. One such cDNA clone (boxed) is a member of the highly conserved polyubiquitin gene family.
Figure 3.
Figure 3.
Evaluation of Microarray Experiments. (A) Expression ratios in green- (G), white- (W), and turning- (T) stage targets relative to red- (R) stage target identified a total of 401 probes corresponding to differentially expressed cDNA clones in the three experiments. The ratios are shown on a logarithmic scale and are ordered per experiment. The top series is cDNAs upregulated in the R stage (177, 105, and 60 cDNAs, respectively), and the bottom series is cDNAs downregulated in the R stage (70, 63, and 77 cDNAs, respectively). Vertical lines represent the least significant ratios at P < 0.05 (3.07, 3.32, and 2.24, respectively) and their reciprocals. (B) Expression ratios for a series of homologous cDNAs in the green, white, and turning stages relative to the red stage (expression ratio marked as 1 for red stage). At the top are 27 cDNAs showing homology to a metallothionein gene (including clone B7); at the bottom, 27 cDNAs show homology to an auxin-induced gene (including clone C58). The GenBank accession numbers (nucleotide sequence) for strawberry cDNA clones B7 and C58 are AI795160 and AI795161, respectively. (C) Precision of the microarray method is illustrated by the scatter plot of 1701 expression ratios estimated in two partial replicates of the green/red experiment. In the first experiment, green fruit target was labeled with Cy5 and red fruit target was labeled with Cy3 and hybridized with a microarray. A second replicate microarray was then hybridized with the dyes reversed (experiment [exp.] designated 1A). In experiment 1B, the first hybridization of experiment 1A was repeated with a third replicate microarray and was analyzed in a “reversed” manner with the results of the second microarray from experiment 1A.
Figure 4.
Figure 4.
Analysis of SAAT and PDC Gene Expression in Strawberry. (A) An overlay image of a subset of a microarray hybridized with samples originating from green and red strawberry fruit mRNA. As given for Figure 2, signal intensities provide an estimate of expression levels, and green or red spot colors correspond to higher transcript levels in the green- or red-stage samples, respectively. The SAAT cDNA appeared as an intense red signal (boxed) and is marked by an arrow (each cDNA was arrayed in duplicate). The physical size of the subarray is ∼4 × 2.5 mm. (B) Expression profiles of SAAT, PDC, and six strawberry pigmentation-related genes during strawberry development, as detected in the microarray experiments. Expression ratios in green, white, and turning stages are relative to the red stage (expression ratio marked as 1 for the red stage).The strawberry genes and their GenBank accession numbers are as follows: CHS, chalcone synthase (AI795154); CHI, chalcone flavanone isomerase (AI795155); F3H, flavanone-3β-hydroxylase (AI795156); ANS, anthocyanidin synthase (AI795157); UFGT, UDP-glucose:flavonoid-3-O-glucosyltransferase (AI795158); GST, glutathione S-transferase (AI795159); SAAT, strawberry AAT (AF193789); PDC, pyruvate decarboxylase (AF193791). G, green stage; R, red stage; T, turning stage; W, white stage. (C) RNA gel blot analysis of the expression of SAAT and PDC in different tissues of strawberry. Lane 1, root; 2, petiole; 3, leaf; 4, flower; 5, green fruit; 6, white fruit; 7, turning fruit; 8, red fruit; 9, achenes; and 10, dark-red fruit. The blot was hybridized with the SAAT probe and then rehybridized with a strawberry cDNA probe showing homology to a gene encoding a ribosomal protein (R. Prot.).
Figure 5.
Figure 5.
Volatile Ester Emission during Strawberry Fruit Development. GC-MS chromatograms (detector response was 100% of 2 × 10⁶ total ion counts) of volatiles in vivo released by strawberry fruits (cv Elsanta) at different stages of development. Developmental stages: DR, dark red; G, green; P, pink; R, red; T, turning; W, white. The five main volatile esters detected are marked with numbers: 1, methyl hexanoate; 2, hexyl acetate; 3, hexyl butanoate; 4, octyl acetate; and 5, octyl butyrate.
Figure 6.
Figure 6.
Protein Sequence Alignment of SAAT and Three Other Related Plant Proteins. The related protein sequences aligned were F21J9.20 and genomic sequences from Arabidopsis bacterial artificial chromosome F21J9 (GenBank accession number AC000103); BEAT, C. breweri acetyl-CoA:benzylalcohol acetyltransferase (GenBank accession number AF043464); and DAT, C. roseus deacetylvindoline 4-O-acetyltransferase (GenBank accession number AF053307). The alignments delineate the following conserved motifs: 1, L-S-Xaa-T-L-Xaa-Xaa-Xaa-Y-Xaa-Xaa-Xaa-G; 2, H-Xaa-Xaa-Xaa-D; and 3, DFGWG.
Figure 7.
Figure 7.
Verification of Ester Formation by the SAAT Protein by GC-MS. GC-MS (detector response, formula image total ion counts) of volatiles produced in the incubation conditions below. (A) Butanol and butyl acetate standards. (B) SAAT protein plus butanol plus acetyl-CoA. (C) As given for (B) but with protein absent. (D) As given for (B) but with butanol absent. (E) As given for (B) but with acetyl-CoA absent. (F) Green fluorescent protein plus butanol plus acetyl-CoA. (G) Empty pRSET B vector eluate plus butanol plus acetyl-CoA. Other visible peaks are impurities from the butanol substrate.
Figure 8.
Figure 8.
SAAT-Catalyzed Ester Formation from 14C-Acetyl-CoA. (A) Flame ionization detector (F.I.D.) signal of unlabeled standards of peak 1, hexylacetate; peak 2, 1-hexanol; peak 3, octylacetate; and peak 4, 1-octanol. (B) and (C) Radiodetector signal of labeled products formed by the SAAT protein from 0.1 mM 14C-acetyl-CoA and alcohols with (B) 2 mM 1-octanol or (C) 2 mM 1-hexanol.
Figure 9.
Figure 9.
AAT Activity of SAAT as a Function of Substrate Concentration for the Formation of Octyl Acetate. (A) For acetyl-CoA (in the presence of 20 mM 1-octanol). (B) For 1-octanol (in the presence of 0.1 mM acetyl-CoA). Equations for fitted curves are (A) formula image + formula image, formula image and (B) formula image + formula image, formula image. Data were obtained by liquid scintillation counting. prod., product.

Comment in

References

    1. Altschul, S.F., Gish, W., Miller, W., Myers, E.W., and Lipman, D.J. (1990). Basic local alignment search tool. J. Mol. Biol. 215, 403–410. - PubMed
    1. Angenent, G.C., Busscher, M., Franken, J., Mol, J.N., and van Tunen, A.J. (1992). Differential expression of two MADS box genes in wild-type and mutant petunia flowers. Plant Cell 4, 983–993. - PMC - PubMed
    1. Belknap, W.R., and Garbarino, J.E. (1996). The role of ubiquitin in plant senescence and stress responses. Trends Plant Sci. 1, 331–335.
    1. Bouwmeester, H.J., Konings, M.C.J.M., Gershenzon, J., Karp, F., and Croteau, R. (1999. a). Cytochrome P-450 dependent (+)-limonene hydroxylation in fruits of caraway. Phytochemistry 50, 243–248.
    1. Bouwmeester, H.J., Wallaart, T.E., Janssen, M.H.A., van Loo, B., Jansen, B.J.M., Posthumus, M.A., Schmidt, C.O., de Kraker, J.-W., König, W.A., and Franssen, M.C.R. (1999. b). Partial purification and characterization of amorpha-4,11-diene synthase. The sesquiterpene synthase catalyzing the first probable step in the biosynthesis of artemisinin. Phytochemistry 52, 843–854. - PubMed

LinkOut - more resources