. 2000 May;12(5):691-706.
doi: 10.1105/tpc.12.5.691.

Virus-induced silencing of a plant cellulose synthase gene

Affiliations

Virus-induced silencing of a plant cellulose synthase gene

R A Burton et al. Plant Cell. 2000 May.

Abstract

Specific cDNA fragments corresponding to putative cellulose synthase genes (CesA) were inserted into potato virus X vectors for functional analysis in Nicotiana benthamiana by using virus-induced gene silencing. Plants infected with one group of cDNAs had much shorter internode lengths, small leaves, and a "dwarf" phenotype. Consistent with a loss of cell wall cellulose, abnormally large and in many cases spherical cells ballooned from the undersurfaces of leaves, particularly in regions adjacent to vascular tissues. Linkage analyses of wall polysaccharides prepared from infected leaves revealed a 25% decrease in cellulose content. Transcript levels for at least one member of the CesA cellulose synthase gene family were lower in infected plants. The decrease in cellulose content in cell walls was offset by an increase in homogalacturonan, in which the degree of esterification of carboxyl groups decreased from approximately 50 to approximately 33%. The results suggest that feedback loops interconnect the cellular machinery controlling cellulose and pectin biosynthesis. On the basis of the phenotypic features of the infected plants, changes in wall composition, and the reduced abundance of CesA mRNA, we concluded that the cDNA fragments silenced one or more cellulose synthase genes.


Figures

Figure 1.
Figure 1.
Alignments of Isolated cDNAs against Plant CesA Genes. (A) Positions and lengths of the three cDNAs (NtCesA-1a, NtCesA-1b, and NtCesA-2) from N. tabacum are shown in relation to the regions of plant CesA genes, as described by Delmer (1999). CRP denotes conserved plant-specific insertions, HVR denotes hypervariable plant-specific insertions, HR denotes homologous regions of all CesA genes, and NC denotes a region with no obvious conservation (Delmer, 1999). The three conserved aspartic acid residues (D) are indicated, together with the conserved QXXRW motif that is believed to be located at the catalytic site (Delmer, 1999). Note that the cDNAs start at different points at their 5′ ends but finish at the same point at their 3′ ends. The position of the fragment amplified during reverse transcription–PCR for estimation of mRNA abundance is also shown. (B) Nucleotide sequence alignments of the N. tabacum cDNAs NtCesA-1a, NtCesA-1b, and NtCesA-2 with the corresponding sequences of CesA genes from Arabidopsis (AtCesA-1) (Arioli et al., 1998) and G. hirsutum (GhCesA-1) (Pear et al., 1996). The regions HR2, HVR2, CRP4, and HR3 are as described in (A). The primers used for nested, anchor-ligated PCR of the region immediately 5′ to the NtCesA-1a cDNA fragment are highlighted in green. The sequence of the 3′ PCR primer included at the 3′ ends of the three Nicotiana spp cDNAs might not correspond exactly with the sequence of the gene itself. Letters on gray background denote one-letter codes for amino acid residues believed to be involved in catalysis (Delmer, 1999). White letters on black background denote nucleotides conserved in at least three of the five sequences. Dots denote gaps introduced by the alignment program.
Figure 2.
Figure 2.
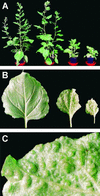
Appearance of Plants Infected with PVX Transcripts. (A) Shown left to right are a PVX control plant, a PVX–NtCesA-2 plant, a PVX–NtCesA-1b plant, and a PVX–NtCesA-1a plant. The severe stunting of the PVX–NtCesA-1 plants is evident. (B) Shown left to right are the abaxial surfaces of fully expanded leaves from PVX control, PVX–NtCesA-1b, and PVX–NtCesA-1a plants. The interveinal regions of PVX control leaves are relatively smooth. (C) Shown is the abaxial surface of the PVX–NtCesA-1b leaf. A pronounced “lumpy” appearance is evident. The texture of leaves from PVX–NtCesA-1 plants was very “crisp” compared with controls.
Figure 3.
Figure 3.
Scanning Electron Micrographs of Leaves from PVX-Infected Plants. (A) A PVX control leaf, showing the relatively smooth epidermal surface and trichomes of the adaxial leaf surface. Numerous airspaces in the spongy and palisade mesophyll are visible in the cross-section of the leaf. (B) A leaf section from a PVX–NtCesA-1b plant, showing the abaxial surface distortions and cells ballooning out from the epidermis. Swollen cells can also be observed on trichomes. The mesophyll appears to have much smaller airspaces. (C) and (D) Abaxial surface views of PVX control and PVX–NtCesA-1b leaves, respectively. (E) and (F) Higher magnification views of PVX control and PVX–NtCesA-1b leaves, respectively. formula image (formula image) formula image (formula image) formula image; formula image (formula image) formula image (formula image) formula image; formula image (formula image) formula image (formula image) formula image.
Figure 4.
Figure 4.
Effects of VIGS on Transcription of CesA Genes. Shown are agarose gels of RT-PCR products generated from primers for GAPDH mRNA (A) and for NbCesA-1 mRNA (B). Total RNA was isolated from leaves of different, individually infected N. benthamiana plants inoculated with the PVX control or PVX–NtCesA-1a/1b (1a and 1b, respectively) constructs. The PCR products were routinely excised from the gel, and their identities were confirmed by nucleotide sequence analysis to be 100% identical with the NbCesA-1 cDNA fragment. Molecular markers (M) are in the first lane, and the arrowheads indicate the 500-bp band. The right-hand lane (N) is the control RT-PCR reaction, in which no DNA was added. The diffuse band seen in this reaction mixture was generated from the oligonucleotide primers.
Figure 5.
Figure 5.
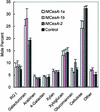
Polysaccharide Compositions of Cell Walls Isolated from Leaves of PVX-Infected Plants. The major differences in polysaccharide compositions are the decreased cellulose and increased homogalacturonan contents of walls from the PVX–NtCesA-1a and PVX–NtCesA-1b plants. A small increase in galactoglucomannan is apparent in walls from the PVX–NtCesA-2 leaves. Specific polysaccharide content was determined as described in Methods from data in Table 2. Error bars show standard errors. RGI, rhamnogalacturonan I.
Figure 6.
Figure 6.
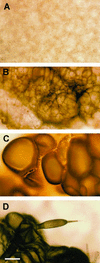
Staining Abaxial Leaf Surfaces for Calcium Pectate by Using NiCl/Na2S. (A) Surface view of a leaf from a PVX–NtCesA-2 plant that shows little staining for calcium pectate. A faint outline of epidermal cells is visible. Leaves from the PVX control plants stain in a similar fashion. (B) to (D) Lumps on leaves of plants infected with PVX–NtCesA-1a show enlarged epidermal cells enriched in calcium pectate, which is concentrated in the walls around the swollen cells. The enlarged cells of PVX–NtCesA-1a leaves show various degrees of staining, presumably because the onset of gene silencing occurs at different stages of development. The surface lumps are those seen in Figures 3B and 3D. An increase in staining intensity from brown to black is indicative of increasing concentrations of calcium pectate. formula image.

References

    1. Arioli, T., et al. (1998). Molecular analysis of cellulose biosynthesis in Arabidopsis. Science 279, 717–720. - PubMed
    1. Bacic, A., Harris, P.J., and Stone, B.A. (1988). Structure and function of plant cell walls. In The Biochemistry of Plants: A Comprehensive Treatise, Vol. 14, Carbohydrates, J. Preiss, ed (New York: Academic Press), pp. 297–371.
    1. Baulcombe, D.C. (1999). Fast forward genetics based on virus-induced gene silencing. Curr. Opin. Plant Biol. 2, 109–113. - PubMed
    1. Baulcombe, D.C., Chapman, S., and Cruz, S.S. (1995). Jellyfish green fluorescent protein as a reporter for virus infections. Plant J. 7, 1045–1053. - PubMed
    1. Brett, C., and Waldron, K. (1990). Physiology and biochemistry of plant cell walls. In Topics in Plant Physiology, M. Black and J. Chapman, eds (London: Unwin Hyman), pp. 6–57.

Publication types

LinkOut - more resources