. 2000 May 15;19(10):2237-46.
doi: 10.1093/emboj/19.10.2237.

Protein phosphatase 1alpha is a Ras-activated Bad phosphatase that regulates interleukin-2 deprivation-induced apoptosis

Affiliations

Protein phosphatase 1alpha is a Ras-activated Bad phosphatase that regulates interleukin-2 deprivation-induced apoptosis

V Ayllón et al. EMBO J. .

Abstract

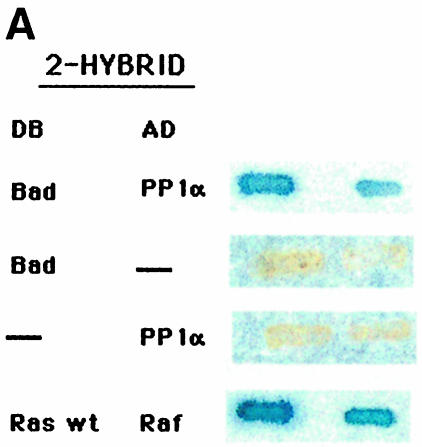
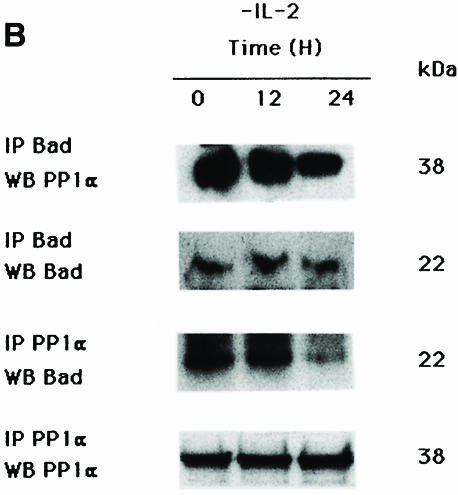
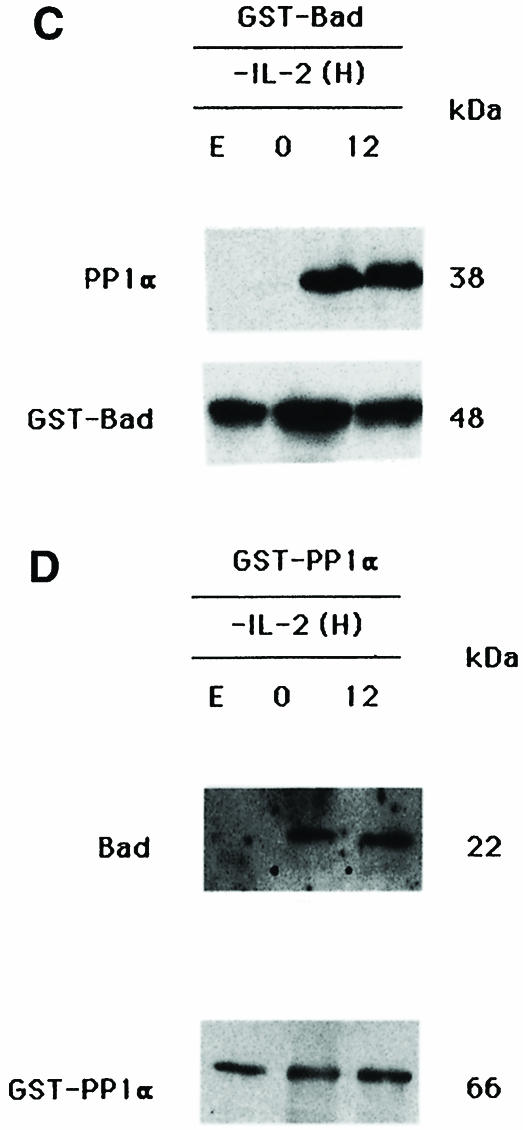
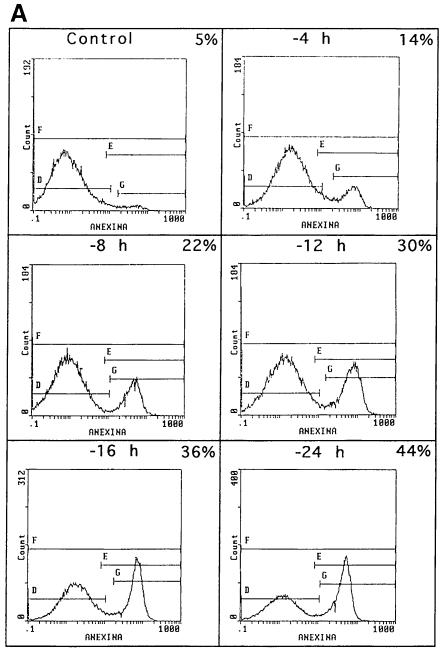
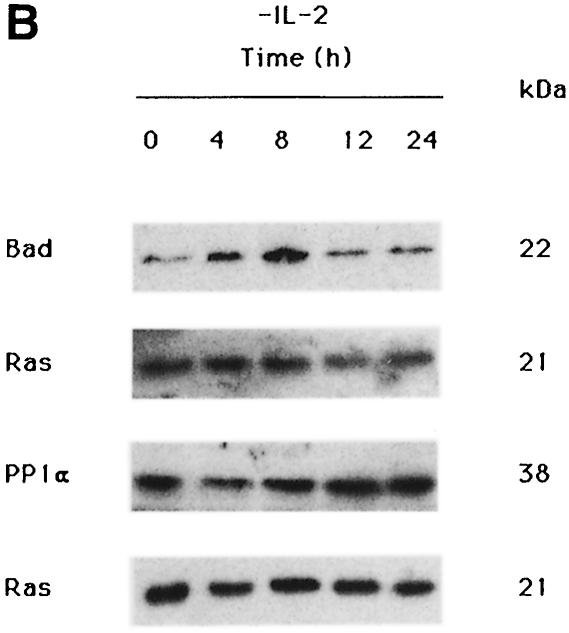
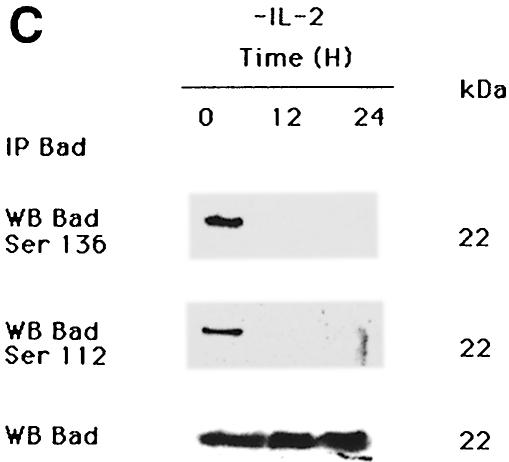
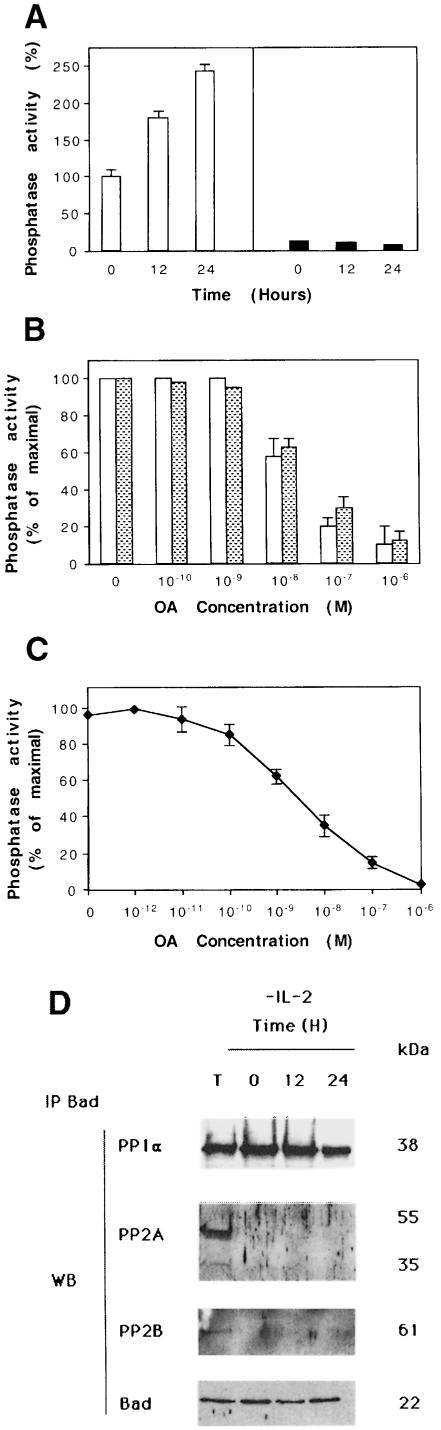
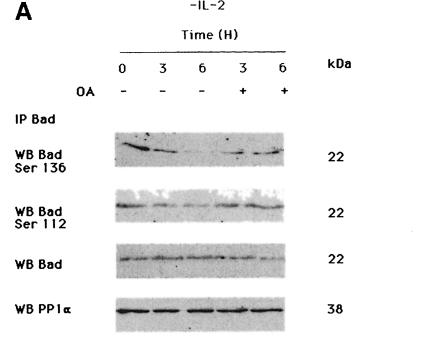
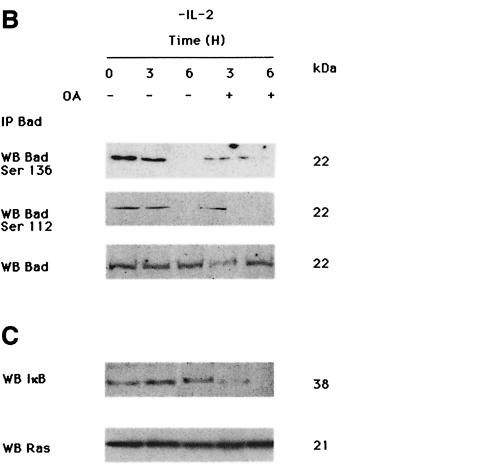
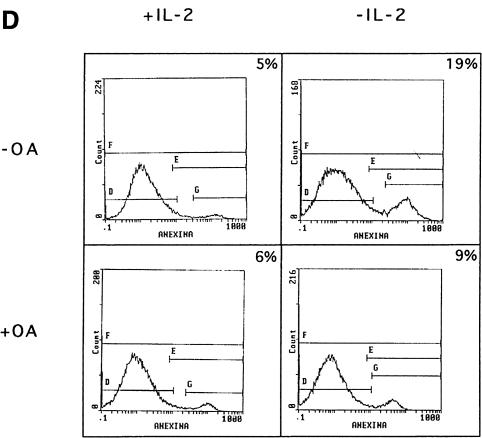
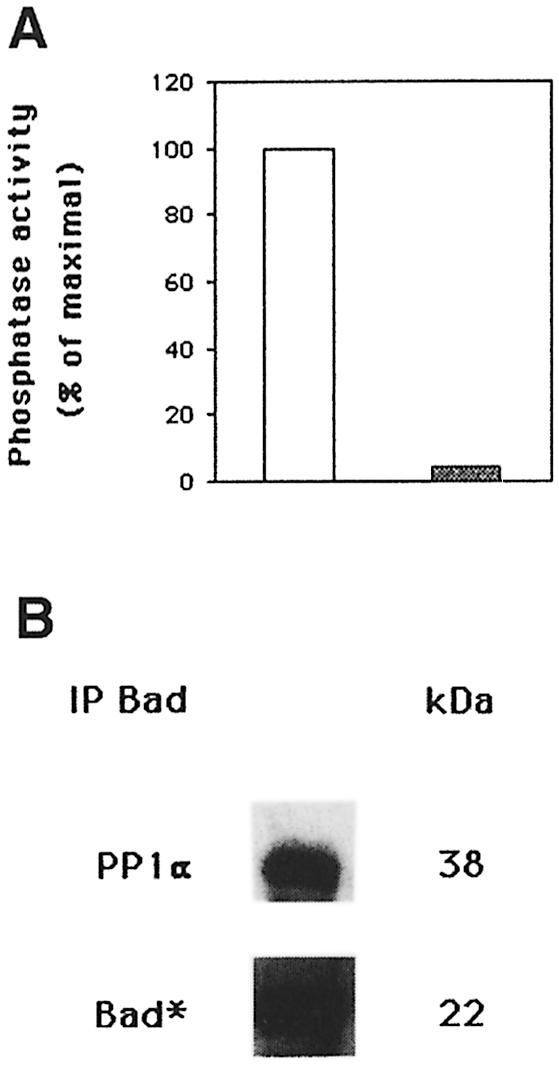
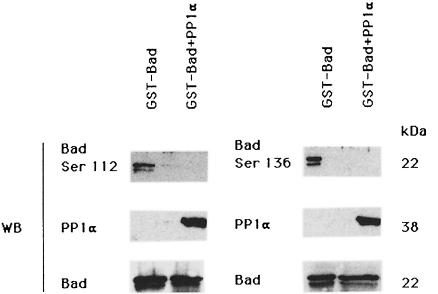
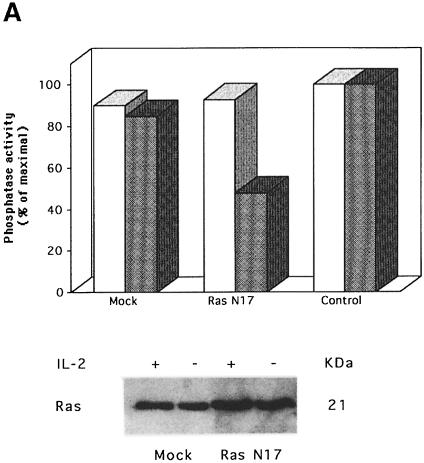
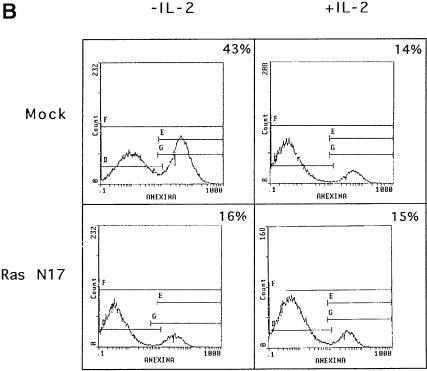
Growth factor deprivation is a physiological mechanism to regulate cell death. We utilize an interleukin-2 (IL-2)-dependent murine T-cell line to identify proteins that interact with Bad upon IL-2 stimulation or deprivation. Using the yeast two-hybrid system, glutathione S-transferase (GST) fusion proteins and co-immunoprecipitation techniques, we found that Bad interacts with protein phosphatase 1alpha (PP1alpha). Serine phosphorylation of Bad is induced by IL-2 and its dephosphorylation correlates with appearance of apoptosis. IL-2 deprivation induces Bad dephosphorylation, suggesting the involvement of a serine phosphatase. A serine/threonine phosphatase activity, sensitive to the phosphatase inhibitor okadaic acid, was detected in Bad immunoprecipitates from IL-2-stimulated cells, increasing after IL-2 deprivation. This enzymatic activity also dephosphorylates in vivo (32)P-labeled Bad. Treatment of cells with okadaic acid blocks Bad dephosphorylation and prevents cell death. Finally, Ras activation controls the catalytic activity of PP1alpha. These results strongly suggest that Bad is an in vitro and in vivo substrate for PP1alpha phosphatase and that IL-2 deprivation-induced apoptosis may operate by regulating Bad phosphorylation through PP1alpha phosphatase, whose enzymatic activity is regulated by Ras.


Figures

None
Fig. 1. Interaction of Bad and PP1α phosphatase. (A) Interaction of Bad and the catalytic subunit of PP1α phosphatase in the two-hybrid system. The S.cerevisiae L40 reporter strain was co-transformed with the plasmids indicated. The interaction between the two-hybrid proteins is indicated by induction of LacZ expression (blue patches). There are two patches for each strain and each patch represents an independent transformant. L40 carrying Ras and Raf was used as positive control. DB, fusion with the DNA-binding domain of Lex10. AD, fusion with the activation domain of Gal4. (B) Reciprocal co-immunoprecipitation of Bad and PP1α. Cytoplasmic lysates from IL-2-stimulated (5 ng/ml) or -deprived cells were immunoprecipitated with anti-Bad antibody, transferred to nitrocellulose and immunoblotted with anti-PP1α and anti-Bad antibody, the latter as internal control. Similarly, PP1α was immunoprecipitated from cytoplasmic lysates from IL-2-stimulated or -deprived cells and immunoblotted with anti-Bad or anti-PP1α antibody, the latter as internal control. Protein bands were detected using the ECL system. Molecular weights of the corresponding proteins are shown. Similar results were obtained in three independent experiments. (C and D) Expression of (C) GST–Bad or (D) GST–PP1α fusion proteins was induced with or without IPTG, and proteins were isolated by affinity chromatography with glutathione–agarose beads and incubated with or without (lane E) cytoplasmic lysates from IL-2-stimulated or -deprived cells. After washing, eluted proteins were resolved by SDS–PAGE, transferred to nitrocellulose and blotted with anti-PP1α or anti-Bad antibody. Protein bands were detected using the ECL system. Molecular weight markers of the corresponding proteins are indicated.
None
Fig. 2. Effect of IL-2 deprivation on Bad and PP1α. (A) Cells were cultured in the presence or absence or IL-2 and harvested at different times. To analyze apoptosis, cells were stained with annexin and propidium iodide and analyzed using fluorescence flow cytometry. Region G corresponds to apoptotic cells. The percentage of apoptosis in each sample is superimposed. Similar results were obtained in three independent experiments. (B) TS1αβ cells were IL-2-stimulated or -deprived for the times indicated, then lysed. Protein extracts were separated by SDS–PAGE, transferred to nitrocellulose and probed with anti-Bad, anti-PP1α and pan-Ras antibodies, the latter as internal control. Protein bands were detected using the ECL system. Molecular weights of the corresponding proteins are shown. Similar results were obtained in three independent experiments. (C) Cytoplasmic lysates from IL-2-stimulated or -deprived cells were immunoprecipitated with anti-Bad antibody, transferred to nitrocellulose and blotted with phospho-Bad Ser112, Ser136 or anti-Bad antibody, the latter as internal control of protein loading. Protein bands were detected using ECL. Molecular weights of the corresponding proteins are shown.
None
Fig. 3. Estimation of serine/threonine phosphatase activity in Bad immunoprecipitates. (A) Phosphatase activity was estimated in Bad immunoprecipitates from IL-2-stimulated or -deprived cells using [32P]phosphorylase a as substrate (open bars). As a negative control, phosphatase activity was estimated in c-Jun immunoprecipitates (black bars). SD is shown for n = 3. Phosphatase activity is represented as a percentage of the maximal activity detected in control IL-2-stimulated cells. (B) Different concentrations of okadaic acid (OA) were added to Bad immunoprecipitates from IL-2-stimulated or 24 h-deprived cells. The reaction was as above. SD is shown for n = 3. Open bars, IL-2 deprivation; shaded bars, IL-2 stimulation. Phosphatase activity is represented as the percentage of maximal activity in untreated immunoprecipitates. (C) Different concentrations of OA were added to the supernatant of Bad immunoprecipitates from IL-2-stimulated cells. The reaction was as in (A). SD is shown for n = 3. Phosphatase activity is represented as the percentage of maximal activity in untreated supernatants. (D) Total extracts (lane T) or cytoplasmic lysates from IL-2-stimulated or -deprived cells immunoprecipitated with Bad were transferred to nitrocellulose and immunoblotted with PP1α. The blot was reprobed with anti-PP2A, anti-PP2B (calcineurin) and Bad antibody. Protein bands were detected using the ECL system. Molecular weights of the corresponding proteins are shown. Similar results were obtained in two independent experiments.
None
Fig. 4. Effect of IL-2 and OA on Ser112 and Ser136 phosphorylation of Bad. (A) Cells were treated with or without 1 µM OA in the absence of IL-2 for different periods of time. Cytoplasmic lysates were immunoprecipitated with anti-Bad antibody and transferred to nitrocellulose. The membrane was probed with phospho-Bad Ser136, Ser112, anti-Bad and anti-PP1α antibody, the last to verify that OA treatment in vivo does not affect PP1α expression. Molecular weights of the corresponding proteins are shown. Protein bands were detected using ECL Plus. (B) Cells were treated with or without 50 nM OA in the absence of IL-2 for different periods of time. Cytoplasmic lysates were treated as in (A). The membrane was probed with phospho-Bad Ser112, Ser136 and anti-Bad antibody, the latter as internal control of protein loading. Molecular weights of the corresponding proteins are shown; protein bands were detected using ECL Plus. (C) Cells were treated with or without 50 nM OA in the absence of IL-2 for different periods of time, then lysed. Protein extracts were separated by SDS–PAGE, transferred to nitrocellulose and probed with anti-IκB and pan-Ras antibodies, the latter as an internal control of protein loading. Molecular weights of the corresponding proteins are shown. Protein bands were detected using ECL. (D) Cells were treated for 6 h with or without 1 µM OA in the presence or absence of IL-2. Cells were washed, stained with annexin and propidium iodide, then analyzed by flow cytometry. Region G of the fluorescence scale represents apoptosis. The percentage of apoptotic cells in each sample is superimposed.
None
Fig. 5. PP1α dephosphorylates 32P-labeled Bad. (A) Cells were labeled for 2 h with [32P]orthophosphate (100 µCi/ml) in phosphate-free Dulbecco’s modified Eagle’s medium (DMEM) with IL-2. Cells were lysed, Bad immunoprecipitated and phosphatase activity estimated by dephosphorylation of 32P-labeled Bad (open bar). As a negative control, phosphatase activity was estimated in c-Jun immunoprecipitates of 32P-labeled cells (shaded bar). (B) Immunoblot of the membrane with anti-PP1α antibody is shown in the upper panel. Quantification by autoradiography of 32P incorporation into Bad is shown in the lower panel.
None
Fig. 6. In vitro dephosphorylation of GST–Bad. GST–Bad fusion protein was incubated for 30 min at 30°C with recombinant PP1α phosphatase. Proteins were separated by SDS–PAGE, transferred to nitrocellulose, blocked and incubated with anti-Bad Ser112 and Ser136. Membranes were reprobed with anti-PP1α and anti-Bad antibody. Protein bands were detected using the ECL system. Molecular weights of the corresponding proteins are shown. Similar results were obtained in two independent experiments.
None
Fig. 7. Overexpression of Ras N17 induces PP1α activity inhibition and prevents apoptosis. (A) Cells were transfected with pHook3 (mock transfectants) or Ras N17 and pHook3 by the DEAE–dextran method and maintained for 24 h in the presence (open bars) or absence (shaded bars) of IL-2. Transfected cells were selected using magnetic beads and phosphatase activity was estimated in Bad immunoprecipitates using [32P]phosphorylase a as substrate. Untransfected cells were used as control. Similar results were obtained in two independent experiments. Phosphatase activity is represented as the percentage of maximal activity in untransfected cells. Expression of the transiently transfected Ras N17 was confirmed by direct comparison of Ras protein levels in mock and transfected cells. (B) Cells were treated as in (A) and then washed, stained with annexin and propidium iodide and analyzed by flow cytometry. Region G of the fluorescence scale represents apoptosis. The percentage of apoptotic cells in each sample is superimposed.

References

    1. Adams J.M. and Cory,S. (1998) The Bcl-2 protein family: arbiters of cell survival. Science, 281, 1322–1326. - PubMed
    1. Alberts A.S., Thorburn,A.M., Shenolikar,S., Mumby,M.C. and Feramisco,J.R. (1993) Regulation of cell cycle progression and nuclear affinity of the Rb protein by protein phosphatases. Proc. Natl Acad. Sci. USA, 90, 388–392. - PMC - PubMed
    1. Axton J.M., Dombradi,V., Cohen,P.T. and Glover,D.M. (1990) One of the protein phosphatase 1 isoenzymes in Drosophila is essential for mitosis. Cell, 63, 33–46. - PubMed
    1. Baharians Z. and Schönthal,A.H. (1999) Reduction of H-Ras induced cellular transformation by elevated expression of protein phosphatase type 2A. Mol. Carcinog., 24, 246–254. - PubMed
    1. Bartel P.L. and Fields,S. (1997) The Yeast Two-Hybrid System. Oxford University Press, New York, NY.

Publication types

LinkOut - more resources