. 2000 May;105(10):1407-17.
doi: 10.1172/JCI8707.

HIV-specific cytotoxic T lymphocytes traffic to lymph nodes and localize at sites of HIV replication and cell death

Affiliations

HIV-specific cytotoxic T lymphocytes traffic to lymph nodes and localize at sites of HIV replication and cell death

S J Brodie et al. J Clin Invest. 2000 May.

Retraction in

Expression of concern in

  • Expression of concern.
    Brodie SJ, Patterson BK, Lewinsohn DA, Diem K, Spach D, Greenberg PD, Riddell SR, Corey L. Brodie SJ, et al. J Clin Invest. 2008 May;118(5):1974. doi: 10.1172/JCI8707EX1. J Clin Invest. 2008. PMID: 18451992 Free PMC article. No abstract available.

Abstract

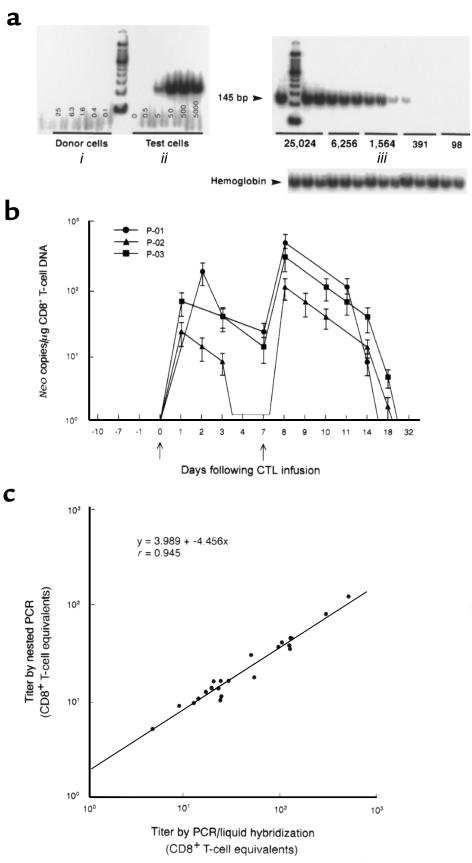
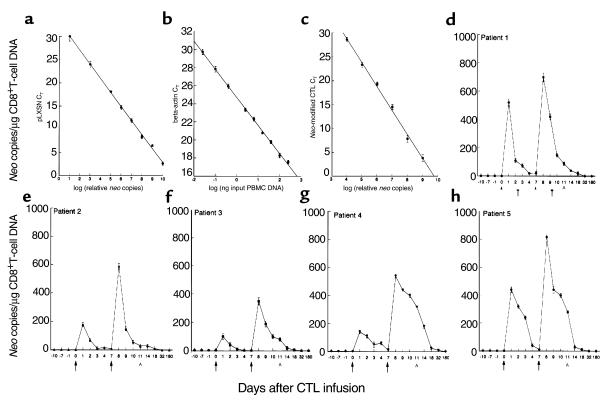
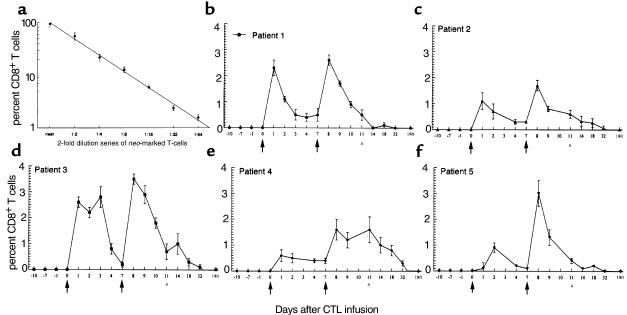
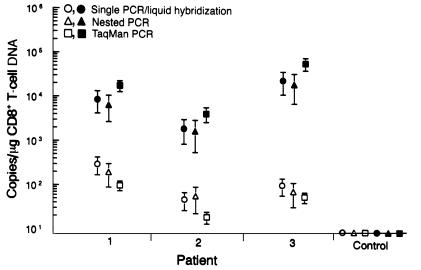
We have tracked the in vivo migration and have identified in vivo correlates of cytotoxic T-lymphocyte (CTL) activity in HIV-seropositive subjects infused with autologous gene-marked CD8(+) HIV-specific CTL. The number of circulating gene-marked CTL ranged from 1.6 to 3.5% shortly after infusion to less than 0.5% 2 weeks later. Gene-marked CTL were present in the lymph node at 4.5- to 11-fold excess and colocalized within parafollicular regions of the lymph node adjacent to cells expressing HIV tat fusion transcripts, a correlate of virus replication. The CTL clones expressed the CCR5 receptor and localized among HIV-infected cells expressing the ligands MIP-1alpha and MIP-1beta, CC-chemokines produced at sites of virus replication. Aggregates of apoptotic cells and cells expressing granzyme-B localized within these same sites. In contrast, lymph node sections from untreated HIV-seropositive subjects, all with significant viral burden (> 50,000 HIV RNA copies/mL plasma), showed no CC-chemokine expression and exhibited only sporadic and randomly distributed cells expressing granzymes and/or apoptotic cells. These studies show that the infused CTL specifically migrate to sites of HIV replication and retain their antigen-specific cytolytic potential. Moreover, these studies provide a methodology that will facilitate studies of both the magnitude and functional phenotype of Ag-specific CD8(+) T cells in vivo.


Figures

Figure 1
Figure 1
Analysis of PBMC for the in vivo persistence of neo-transduced CD8+ gag-specific T cells. (a) Limiting dilution PCR and 32P liquid hybridization strategy for neo DNA in PBMC lysates. (i) The titration curve in an HIV-seronegative (uninfused) individual. All lanes are negative. (ii) Illustration of the dilution curve containing DNA extracted from 0 to 5,000 cloned CD8+ T cells transduced with one copy of the neo gene. The cells were diluted into PBMC of an untreated donor to equalize the cellular DNA in all wells. The assay is capable of detecting as few as 5 neo copies (5 positive cells) per microgram of PBMC DNA. Independent determinations of the frequency of neo-modified cells varied up to 0.5 log. (iii) Serial dilutions of PBMC from a patient who received the second infusion of neo-modified T cells (3.3 × 10⁹ cells/m2) 24 hours earlier (patient 1). Endpoint dilution analysis indicates a titer of 2,558 infused neo-positive cells/106 PBMC (1 in 391 PBMC). Negative controls consisted of DNA extracted from PBMC before CTL infusions. All samples were positive for the β-hemoglobin gene. (b) Using a single-round PCR and liquid hybridization strategy, the in vivo persistence of neo-marked T cells was assessed in peripheral blood collected before, during, and after adoptive transfer. The absolute number of CD8+ T cells in PBMC was determined by flow cytometry for each time point. Data points indicate mean ± SEM and represent the number of neo copies per microgram of CD8+ T-cell DNA. Arrows indicate the day of neo-marked T-cell infusions. All samples were run in triplicate, and all assays were repeated at least twice. (c) Comparison of PCR/liquid hybridization strategy (described above) with nested PCR in clinical samples, as described in Methods.
Figure 2
Figure 2
Analysis of PBMC for the in vivo persistence of neo-transduced CD8+ gag-specific T cells by TaqMan PCR. (a and b) Standard curves of neo and β-actin, respectively. Neo plasmid DNA (a) and genomic (PBMC) DNA (b) were diluted serially 1:5 before amplification with the appropriate primer sets. The β-actin standard curve was used to normalize the results obtained from patient PBMC to 1 μg of genomic DNA. (c) Serial 10-fold titration of neo-positive clones starting with an input ratio of 1 part neo DNA to 9 parts genomic DNA. Controls (ac) illustrate the linearity, sensitivity, and reproducibility of TaqMan PCR. (dh) The amount of neo present in recovered patient PBMC before, during, and after CTL infusions per microgram of CD8+ T-cell DNA. Parts dh represent patients 1–5, respectively. All figures show DNA concentration of the samples plotted verses threshold cycle (CT), and all time points represent the mean ± SEM of triplicate PCR amplifications. This assay is highly quantitative and capable of detecting ≤ 2 neo copies per 1 μg of PBMC DNA. Independent determinations of the frequency of neo-marked CD8+ cells in PBMC varied ≤ 0.2 log. Arrows indicate the day of T-cell infusions. AAn inguinal lymph node biopsy. All assays were repeated at least twice. Error bars are shown (some are not visible).
Figure 3
Figure 3
Analysis of PBMC for the in vivo persistence of neo-transduced CD8+ T cells by PCR-ISH and two-color flow cytometry. PBMC from five patients (bf) were assessed for neo before, during, and after adoptive transfer of neo-transduced T cells. This assay was capable of identifying individual neo-modified cells. Independent determinations of the frequency of neo-marked CD8+ cells in PBMC varied up to 0.2%. Results represent mean ± SEM of samples run in triplicate. Arrows indicate the day of T-cell infusions. AAn inguinal lymph node biopsy. All assays were repeated at least twice.
Figure 4
Figure 4
Comparison of solution-phase PCR assays for the quantification of neo in lymph node mononuclear cells (filled symbols) and concurrent analysis of PBMC (open circles). Sample preparation, assay procedures, and controls are as described in Methods. For negative controls, lymph node and blood leukocytes were obtained 1 year previously from patient 1 and represent unmodified (neo-negative) CD8+ T cells. Data points denote mean ± SEM for neo and represent the end-point titer per microgram of CD8+ T-cell DNA. All samples were run in triplicate and all assays repeated at least twice.
Figure 5
Figure 5
Visualization of neo-transduced CD8+ T cells by confocal laser microscopy. Cells were prepared as described in Methods and shown in Figure 4. (a) Neo-marked CD8+ T-cell clones examined before patient infusions. More than 98% of the cloned cells stained for CD8 and neo was detected in more than 95% of these CD8+ T cells (shown is clone LN-2A3-5 from patient 1). Cells containing neo amplimers emit yellow-red fluorescence with a peak fluorescence intensity of 3327. Nontransduced (neo-negative) cells appear purple-blue with a peak fluorescence intensity of 256 (inset). (b) Pictured is a neo-positive cell recovered from a lymph node biopsy taken 4 days after the final T-cell infusion and visualized using the technique of Z-banding. Shown is a 1-μm section taken approximately through the center of a single cell. Note that signal is exclusively intranuclear and has a similar fluorescent intensity to the preinfusion CTL clones (patient 1). (c) For comparison, a similar in situ hybridization procedure, as described previously (6, 7), was used to identify cells in lymph node with transcriptionally active HIV. Gag-positive cells emit intense yellow-red fluorescence with intensities ranging from 2,048 to 3,327 (patient 1). However, unlike neo, the signal is found in both the nucleus and cytoplasm, as would be expected with productive infection. (df) Dual detection of neo+ and CD8+ T cells from (d) preinfusion and (e) postinfusion PBMC (patient 5). The CD8 surface antigen was detected using a PE-conjugated antibody and was the only fluorochrome observed (appears red) in preinfusion PBMC samples (d; day 0). In contrast, up to 3% of PBMCs taken immediately after infusion show both markers and appear yellow (e; day 8). Neo was not detected in cells that did not stain with antibodies to CD8 (f).
Figure 6
Figure 6
Representative histologic sections of inguinal lymph node collected from patient 2 by excisional biopsy 4 days after the second infusion of neo-modified HIV-specific CTL. Serial sections were analyzed for sites of localization of neo-modified CD8+ CTL (PCR-ISH) (a), cells expressing granzyme-B (anti-GrB mAb) (b), cells expressing HIV tat fusion transcripts (RT-PCR-ISH) (c), cells expressing the CC-chemokine MIP-1β (anti-human MIP-1β mAb) (d), and cells showing DNA fragmentation (TUNEL “apoptosis” assay) (e). Dual stains were used to identify the proportion of CD4+ (anti-CD4 mAb + TUNEL) (f; inset shows higher magnification of dual-stained cells [arrows]) and CD8+ (anti-CD8 mAb + TUNEL) (g) T lymphocytes demonstrating apoptosis. The HIV-specific CTL expressed the cell surface receptors CD8 and CCR5 and could be stimulated to express granzyme-B before their infusion (h: anti-CD8 mAb (left), anti-CCR5 mAb (middle), anti-GrB mAb (right). Antibody labels were detected by immunoperoxidase staining with DAB as the chromogen and apoptotic cells detected by TUNEL, followed by anti-DIG mAb, and developed with BCIP/NBT. f, follicular germinal centers. Bar, 100 μm.

Comment in

References

    1. Klein MR, et al. Kinetics of Gag-specific cytotoxic T lymphocyte responses during the clinical course of HIV-1 infection: a longitudinal analysis of rapid progressors and long-term asymptomatics. J Exp Med. 1995;181:1365–1372. - PMC - PubMed
    1. Schmitz JE, et al. Control of viremia in simian immunodeficiency virus infection by CD8+ lymphocytes. Science. 1999;283:857–860. - PubMed
    1. Lisziewicz J, et al. Control of HIV despite the discontinuation of antiretroviral therapy. N Engl J Med. 1999;340:1683–1684. - PubMed
    1. Koup RA, et al. Temporal association of cellular immune responses with the initial control of viremia in primary human immunodeficiency virus type 1 syndrome. J Virol. 1994;68:4650–4655. - PMC - PubMed
    1. Borrow P, Lewicki H, Hahn BH, Shaw GM, Oldstone MB. Virus-specific CD8+ cytotoxic T-lymphocyte activity associated with control of viremia in primary human immunodeficiency virus type 1 infection. J Virol. 1994;68:6103–6110. - PMC - PubMed

Publication types