. 2000 May 15;191(10):1789-98.
doi: 10.1084/jem.191.10.1789.

Thrombospondin-1 is downregulated by anoxia and suppresses tumorigenicity of human glioblastoma cells

Affiliations

Thrombospondin-1 is downregulated by anoxia and suppresses tumorigenicity of human glioblastoma cells

M Tenan et al. J Exp Med. .

Abstract

Angiogenesis, the sprouting of new capillaries from preexisting blood vessels, results from a disruption of the balance between stimulatory and inhibitory factors. Here, we show that anoxia reduces expression of thrombospondin-1 (TSP-1), a natural inhibitor of angiogenesis, in glioblastoma cells. This suggests that reduced oxygen tension can promote angiogenesis not only by stimulating the production of inducers, such as vascular endothelial growth factor, but also by reducing the production of inhibitors. This downregulation may significantly contribute to glioblastoma development, since we show that an increase in TSP-1 expression is sufficient to strongly suppress glioblastoma cell tumorigenicity in vivo.


Figures

Figure 1
Figure 1
Immunoprecipitation of cellular p53 and TSP-1. Clones wt4 and wt11, derived from parental LN-Z308 cells, contain a wt TP53 gene under a tetracycline-regulated promoter (+, with tet; −, without tet). In the wt1 clone, p53 is not induced upon tetracycline removal and served as a negative control 13. The antibodies used were A6.1 (GIBCO BRL) for TSP-1 and G59-13 (PharMingen) for p53. Similar results were obtained with anti-TSP-1 antibody A4.1 (GIBCO BRL) (not shown).
Figure 2
Figure 2
(a) Northern blotting on total RNA of glioblastoma cell lines exposed for 24 or 48 h (D247MG) to normoxia (N) and anoxia (A) (LN-229, n = 3; LN-Z308, U87MG, and D247MG, n = 2). cDNA probes for TSP-1, VEGF, fibronectin (FN), and TIMP-1 were used. 18S rRNA (18S) was revealed with methylene blue staining. (b) Analysis of TSP-1 expression by Western blotting on 24- or 48-h (D247MG) conditioned media from glioblastoma cell lines exposed to normoxia (N) and anoxia (A) (n = 3). Mouse anti–TSP-1 mAb A6.1 (Neomarkers) was used. (c) Silver staining of secreted proteins from glioblastoma cell lines exposed to normoxia (N) and anoxia (A) for 24 and 48 h (D247MG) (n = 5). Black arrows provide examples of large proteins for which secretion is not affected by anoxia. Open arrows show proteins for which secretion is decreased under anoxia. Proteins from 105 (U87MG, D247MG), 2.5 × 10⁵ (LN-Z308), and 37.5 × 10⁵ (LN-229) cells were loaded. (d) Northern blotting on total RNA of LN-229 glioblastoma cells treated with cobalt chloride at different concentrations (C100, 100 μM; C200, 200 μM; and C400, 400 μM) for 24 h (n = 2). Time zero, t0 (no cobalt treatment); normoxia for 24 h (N). (e) Nuclear run-on assay for TSP-1 mRNA from LN-229 cells. Nuclear extracts were prepared after 24 h normoxia (N), 12 h anoxia (A12), and 24 h anoxia (A24) (n = 2). Empty vector DNAs were used as controls (pcDNA1neo for TSP-1; pBspt-KS for VEGF). The controls of this experiment were previously reported 10.
Figure 2
Figure 2
(a) Northern blotting on total RNA of glioblastoma cell lines exposed for 24 or 48 h (D247MG) to normoxia (N) and anoxia (A) (LN-229, n = 3; LN-Z308, U87MG, and D247MG, n = 2). cDNA probes for TSP-1, VEGF, fibronectin (FN), and TIMP-1 were used. 18S rRNA (18S) was revealed with methylene blue staining. (b) Analysis of TSP-1 expression by Western blotting on 24- or 48-h (D247MG) conditioned media from glioblastoma cell lines exposed to normoxia (N) and anoxia (A) (n = 3). Mouse anti–TSP-1 mAb A6.1 (Neomarkers) was used. (c) Silver staining of secreted proteins from glioblastoma cell lines exposed to normoxia (N) and anoxia (A) for 24 and 48 h (D247MG) (n = 5). Black arrows provide examples of large proteins for which secretion is not affected by anoxia. Open arrows show proteins for which secretion is decreased under anoxia. Proteins from 105 (U87MG, D247MG), 2.5 × 10⁵ (LN-Z308), and 37.5 × 10⁵ (LN-229) cells were loaded. (d) Northern blotting on total RNA of LN-229 glioblastoma cells treated with cobalt chloride at different concentrations (C100, 100 μM; C200, 200 μM; and C400, 400 μM) for 24 h (n = 2). Time zero, t0 (no cobalt treatment); normoxia for 24 h (N). (e) Nuclear run-on assay for TSP-1 mRNA from LN-229 cells. Nuclear extracts were prepared after 24 h normoxia (N), 12 h anoxia (A12), and 24 h anoxia (A24) (n = 2). Empty vector DNAs were used as controls (pcDNA1neo for TSP-1; pBspt-KS for VEGF). The controls of this experiment were previously reported 10.
Figure 3
Figure 3
Analysis of TSP-1 expression by Western blotting on serum-free conditioned media from LN-229 clones. Medium from 105 cells was loaded for each clone. A7, A8, A9, control clones; C8, C9, E7, TSP-1–expressing clones. The position and size in kilodaltons of molecular mass markers are indicated to the left. In addition to full-length TSP-1, a 160-kD proteolytic fragment was also seen in clones C9 and E7 similar to previous observations 47. Scanning of the 180-kD bands gave the following values: 217 (A7), 82 (A8), 131 (A9), 328 (C8), 2,396 (C9), and 4,100 (E7). The mean of the control clones is 143. Therefore, C8 shows a 2.3-fold, C9 a 16.7-fold, and E7 a 28.6-fold increase in TSP-1 expression.
Figure 5
Figure 5
(A) Tumor weights (grams) of mice killed at 9 wk. C, control tumor; TSP-1, TSP-1 tumor. Asterisk (*), mice killed 2 wk after injection due to extensive skin damage after mice fightings. −, no tumor. The difference of mean tumor weight between C and TSP-1 tumors was found to be highly significant (Student's t test; P = 0.0002, n = 27). (B) Measurements of tumor microvessel density. C, control tumor; TSP-1, TSP-1 tumor. Microvessels were counted by three independent investigators. Graphic signs allow one to individually identify microvessel density for tumors of each mouse presented in A. Three cases could not be counted, as no TSP-1 tumor could be detected (mice C9/1 and E7/5), or the tumor was too small to be scored (C9/4). Between C and TSP-1 tumors, the difference in the mean number of microvessels was found to be highly significant (Student's t test; P < 0.0001, n = 24).
Figure 4
Figure 4
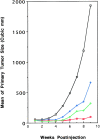
Tumor size measurements in mice injected with a pool of cells from control clones (Control) and cells from individual TSP-1–expressing clones (C8, C9, E7). 5 mice were injected for each clone in two independent experiments (10 mice per clone total).
Figure 4
Figure 4
Tumor size measurements in mice injected with a pool of cells from control clones (Control) and cells from individual TSP-1–expressing clones (C8, C9, E7). 5 mice were injected for each clone in two independent experiments (10 mice per clone total).
Figure 6
Figure 6
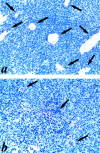
Immunostaining for vessels in tumors from mouse C8/9 using anti-CD31 antibody. (a) Control tumor. (b) TSP-1 tumor. Arrows indicate vessels and capillaries.

References

    1. Fults D., Brockmeyer D., Tullous M.W., Pedone C.A., Cawthon R.M. p53 mutation and loss of heterozygosity on chromosomes 17 and 10 during human astrocytoma progression. Cancer Res. 1992;52:674–679. - PubMed
    1. Li J., Yen C., Liaw D., Podsypanina K., Bose S., Wang S.I., Puc J., Miliaresis C., Rodgers L., McCombie R. PTEN, a putative protein tyrosine phosphatase gene mutated in human brain, breast, and prostate cancer. Science. 1997;275:1943–1947. - PubMed
    1. Steck P.A., Pershouse M.A., Jasser S.A., Yung W.K., Lin H., Ligon A.H., Langford L.A., Baumgard M.L., Hattier T., Davis T. Identification of a candidate tumour suppressor gene, MMAC1, at chromosome 10q23.3 that is mutated in multiple advanced cancers. Nat. Genet. 1997;15:356–362. - PubMed
    1. Gall C.M. Angiogenesis in human astrocytomas. In: Black P.M., Schoene W.C., Lampson L.A., editors. Contemporary Issues in Neurological Surgery. Astrocytomasdiagnosis, treatment, and biology. Blackwell Scientific Publications; Boston: 1991. pp. 241–249.
    1. Stan A.C., Nemati M.N., Pietsch T., Walter G.F., Dietz H. In vivo inhibition of angiogenesis and growth of the human U-87 malignant glial tumor by treatment with an antibody against basic fibroblast growth factor. J. Neurosurg. 1995;82:1044–1052. - PubMed

Publication types

MeSH terms