Comparative Study
. 2000 May 23;97(11):5773-8.
doi: 10.1073/pnas.100126597.

Expression profiling of pancreatic beta cells: glucose regulation of secretory and metabolic pathway genes

Affiliations
Comparative Study

Expression profiling of pancreatic beta cells: glucose regulation of secretory and metabolic pathway genes

G C Webb et al. Proc Natl Acad Sci U S A. .

Abstract

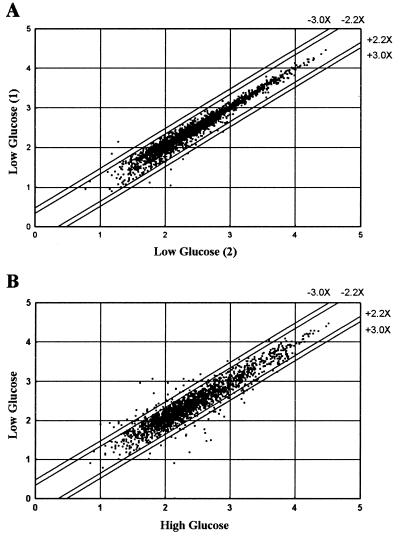
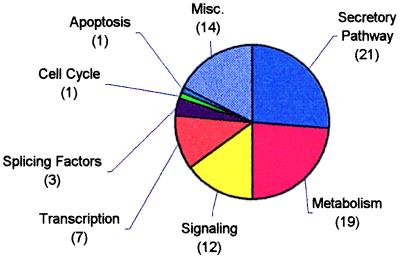
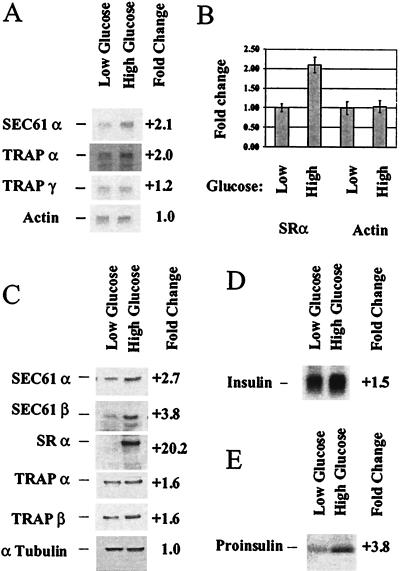
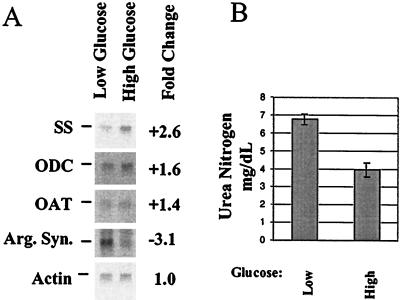
Pancreatic beta cells respond to changes in blood glucose by secreting insulin and increasing insulin synthesis. To identify genes used in these responses, we have carried out expression profiling of beta cells exposed to high (25 mM) or low (5.5 mM) glucose by using oligonucleotide microarrays. Functional clustering of genes that averaged a 2.2-fold or greater change revealed large groups of secretory pathway components, enzymes of intermediary metabolism, cell-signaling components, and transcription factors. Many secretory pathway genes were up-regulated in high glucose, including seven members of the endoplasmic reticulum (ER) translocon. In agreement with array analysis, protein levels of translocon components were increased by high glucose. Most dramatically, the alpha subunit of the signal recognition particle receptor was increased over 20-fold. These data indicate that the translocon and ribosome docking are major regulatory targets of glucose in the beta cell. Analysis of genes encoding enzymes of intermediary metabolism indicated that low glucose brought about greater utilization of amino acids as an energy source. This conclusion was supported by observations of increased urea production under low-glucose conditions. The above results demonstrate genome-wide integration of beta-cell functions at the level of transcript abundance and validate the efficacy of expression profiling in identifying genes involved in the beta-cell glucose response.


Figures

Figure 1
Figure 1
Scatter plot analysis of expression levels. The expression level for each probe set was plotted to determine the reproducibility of the array-based hybridization signals and to compare gene expression levels of MIN6 cells grown in high- vs. low-glucose media. Transcript expression levels [logΣ (PM-MM)/pairs in average, log Avg Diff] of two separate flasks of MIN6 cells grown in low-glucose medium for 24 h were compared (A). Transcript expression levels of MIN6 cells grown in high- vs. low-glucose media for 24 h were compared (B). The parallel lines flanking the diagonal indicate 2.2- and 3.0-fold changes in gene expression.
Figure 2
Figure 2
Pie chart demonstrating the relative sizes of functional clusters of genes up- or down-regulated by incubation of MIN6 cells for 24 h in high (25 mM) or low (5.5 mM) glucose.
Figure 3
Figure 3
Analysis of representative translocon component transcripts and proteins confirms changes in mRNA levels and demonstrates changes in encoded protein levels. Northern blotting was carried out on poly(A)+ RNA (0.2 μg/lane) from MIN6 cells incubated for 24 h in high (25 mM) or low (5.5 mM) glucose to determine changes in expression level in translocon components (A). Each blot was reprobed for β actin to normalize quantitation. Taqman assay was carried out on 0.2 ng poly(A)+ RNA from MIN6 cells treated as in A to determine changes in expression level of SRα (B). Protein was extracted from MIN6 cells treated as in A and immunoblots of translocon components performed (C). Northern blotting was carried out on poly(A)+ RNA (0.05 μg/lane) from MIN6 cells treated as in A and probed for insulin (D). MIN6 cells treated as in A were pulse labeled and insulin immunoprecipitated (E).
Figure 4
Figure 4
Analysis of nitrogen metabolism transcripts confirms changes in mRNA levels, and analysis of urea production confirms the functional consequence of this regulation. Northern blotting was carried out on poly(A)+ RNA (0.2 μg/lane) from MIN6 cells grown for 24 h in high (25 mM) or low (5.5 mM) glucose to determine changes in expression level in nitrogen metabolism components (A). Each blot was reprobed for β actin to normalize quantitation. Media from cells grown as above were analyzed to determine the concentration of secreted urea (B).

References

    1. Lang J. Eur J Biochem. 1999;259:3–17. - PubMed
    1. Itoh N, Okamoto H. Nature (London) 1980;283:100–102. - PubMed
    1. Welsh M, Scherberg N, Gilmore R, Steiner D F. Biochem J. 1986;235:459–467. - PMC - PubMed
    1. Bollheimer L C, Skelly R H, Chester M W, McGarry J D, Rhodes C J. J Clin Invest. 1998;101:1094–1101. - PMC - PubMed
    1. Tasaka Y, Marumo K, Inoue Y, Hirata Y. Acta Endocrinol. 1986;113:355–362. - PubMed

Publication types

MeSH terms

LinkOut - more resources