. 2000 May 23;97(11):5746-9.
doi: 10.1073/pnas.100422497.

Protein oxidation in response to increased transcriptional or translational errors

Affiliations

Protein oxidation in response to increased transcriptional or translational errors

S Dukan et al. Proc Natl Acad Sci U S A. .

Abstract

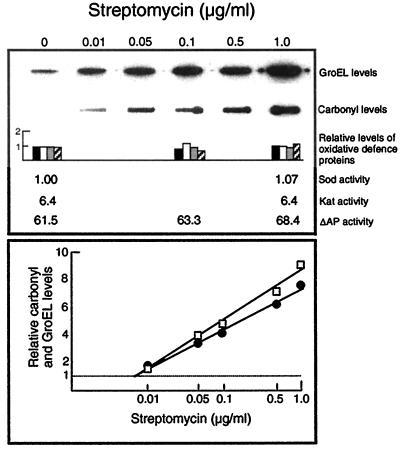
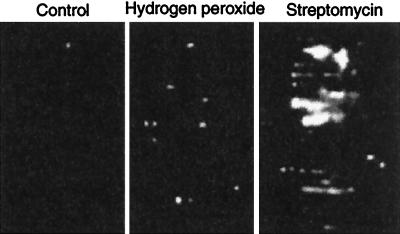
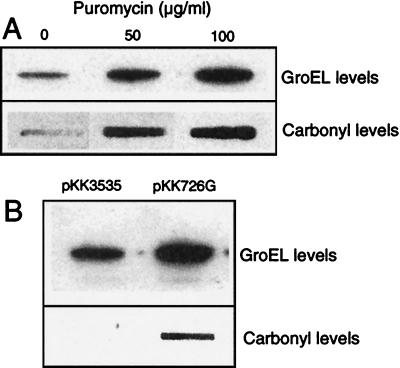
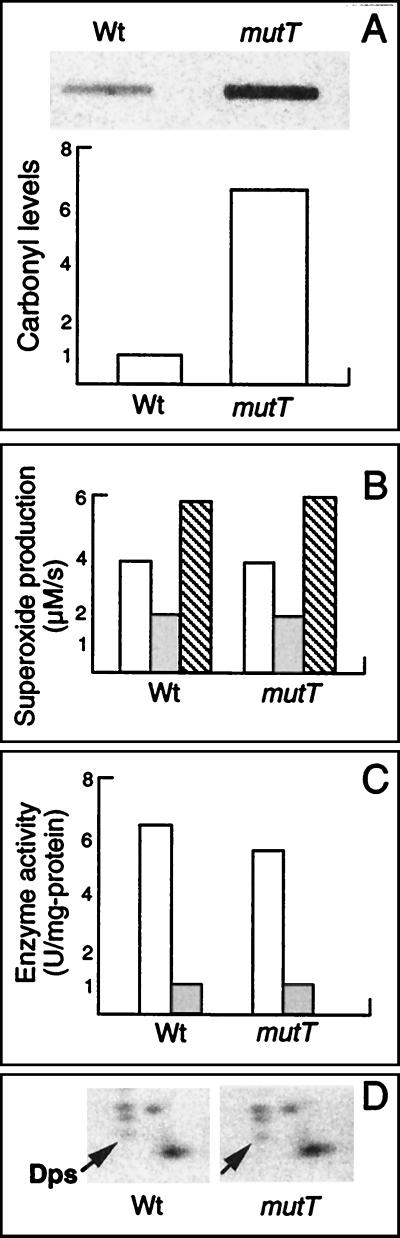
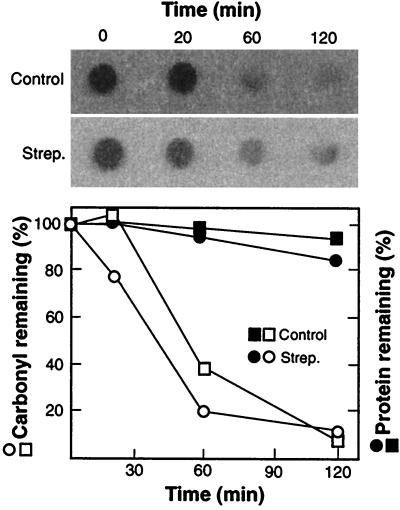
In this study, we show a correlation between synthesis of aberrant proteins and their oxidative modification. The level of aberrant proteins was elevated in Escherichia coli cultures by decreasing transcriptional or translational fidelity using specific mutations or drugs. Protein carbonylation, an oxidative modification, increased in parallel to the induction of the heat shock chaperone GroEL. As the protein turnover rates and level of intracellular oxidative stress remained unchanged, it appears that carbonylation results from the increased susceptibility of the misfolded proteins. These studies show that the cellular protein oxidation is not limited only by available reactive oxygen species, but by the levels of aberrant proteins. Thus, protein oxidation seen in aging cells may be the consequence also of reduced transcriptional/translational fidelity, and protein structures appear to have evolved to minimize oxidative damage. In addition, we discuss the possibility that carbonylation, being an unrepairable protein modification, may serve as a tagging system to shunt misfolded proteins between pathways of refolding by chaperones or the proteolytic apparatus.


Figures

Figure 1
Figure 1
Effects of streptomycin on total carbonyl content (□) and GroEL production (●) in E. coli MG1655. Cells were treated with streptomycin concentrations ranging from 0.01 to 1 μg/ml, which have no effect on growth rate (data not shown), and crude extracts were used for carbonyl content quantification (7). In the same samples, GroEL levels were determined by Western blot analysis using monoclonal mouse anti-GroEL antibodies. Quantification of carbonyl and GroEL levels were obtained using the ImageQuant software (Molecular Dynamics). The carbonyl and GroEL levels in the nontreated controls were assigned a value of 1.0. The relative rates of SodA (black bars), KatE (open bars), Dps (gray bars), and GorA (hatched bars) production in nontreated and streptomycin-treated cells were determined as described (7). Sod and Kat activity was determined and expressed as described in Materials and Methods and the extent of disulfide bond formation (ΔAP activity) was as described in refs. and . The analysis was repeated three times to confirm reproducibility. Representative results are presented and the SD was always <20% between experiments.
Figure 2
Figure 2
Protein carbonylation determined by two-dimensional Western blot immunoassay. Crude extracts from cells treated with 0 and 1 μg/ml of streptomycin and 200 μM hydrogen peroxide were processed for resolution on two-dimensional polyacrylamide (19) with modifications (20). Autoradiograms were obtained after carbonyl immunoassay of proteins (5). The analysis was repeated three times to confirm reproducibility. Representative results are shown.
Figure 3
Figure 3
Correlation between mistranslation and protein carbonylation. Two methods to induce mistranslation were tested: (A) addition of various puromycin concentrations and (B) transformation of cells with pKK726G which contains a single base change in 16S rRNA (C-726 to G) and a control plasmid, pKK3535, which contains the complete E. coli rrnB operon. Because MG1655 carrying pKK726G has a temperature-sensitive phenotype, cells were grown at 30°C. Quantification of carbonyl content and GroEL levels was performed as described in the legend to Fig. 1. The analysis was repeated three times to confirm reproducibility. Representative results are shown and SD was always <20%.
Figure 4
Figure 4
Carbonylation, superoxide production, superoxide dismutase and catalase activity, and oxidative stress protein production in the mutT mutant compared with the wild-type strain. (A) Protein carbonyl levels in the wild-type (MG1655) and the mutT mutant strain. (B) Production of superoxide in the membrane vesicles (open bars), cytosolic fraction (gray bars), and total protein fraction (hatched bars) of a Φ(sodA′-′lacZ)49 Φ(sodB-kan)Δ2 and a Φ(sodA′-′lacZ)49 Φ(sodB-kan)Δ2 ΔmutT leu∷Tn10 strain. Each value represents the mean of triplicate determinations at two different protein concentrations and the variation between the measurements was <5%. (C) Catalase (open bars) and superoxide dismutase (gray bars) activity in crude extracts obtained from wild-type (Wt) and mutT mutants. Each value represents the mean of triplicate determinations at two different proteins concentration and the variation between the measurements was <10%. (D) Rate of synthesis of the oxidative stress protein Dps in the wild-type and mutT mutants. The autoradiograms show part of the two-dimensional gel with the Dps protein indicated with the arrow. The cells were pulse labeled during exponential growth (A420 = 0.4 ± 0.05) with radioactive methionine as described previously (15).
Figure 5
Figure 5
Turnover of bulk (●, ■) and carbonylated (○, □) proteins in streptomycin-treated (○, ●) and nontreated (□, ■) control cultures. The relative stability of total protein or carbonylated proteins was determined after protein synthesis was inhibited by spectinomycin (100 μg/ml) as described in ref. . Spectinomycin was added at an OD600 of 0.5. Mistranslation was induced by adding 1 μg/ml streptomycin to the cultures several generations before the block in protein synthesis. Quantification of carbonyl content was performed as described in the legend to Fig. 1.

Similar articles

Cited by

References

    1. Stadtman E R. Science. 1992;257:1220–1224. - PubMed
    1. Sohal R S, Agarwal S, Dubey A, Orr W C. Proc Natl Acad Sci USA. 1993;90:7255–7259. - PMC - PubMed
    1. Murakami S, Johnson T E. Curr Biol. 1998;8:1091–1094. - PubMed
    1. Lin Y J, Seroude L, Benzer S. Science. 1998;282:943–946. - PubMed
    1. Rosenberger R F. Mutat Res. 1991;256:255–262. - PubMed

Publication types

LinkOut - more resources