Comparative Study
. 2000 May;21(5):881-90.

Dynamic contrast-enhanced T2-weighted MR imaging of recurrent malignant gliomas treated with thalidomide and carboplatin

Affiliations
Comparative Study

Dynamic contrast-enhanced T2-weighted MR imaging of recurrent malignant gliomas treated with thalidomide and carboplatin

S Cha et al. AJNR Am J Neuroradiol. 2000 May.

Abstract

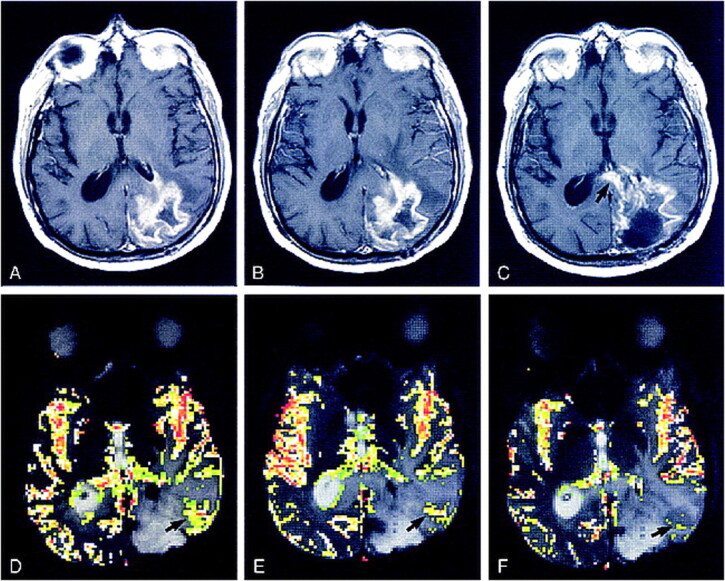
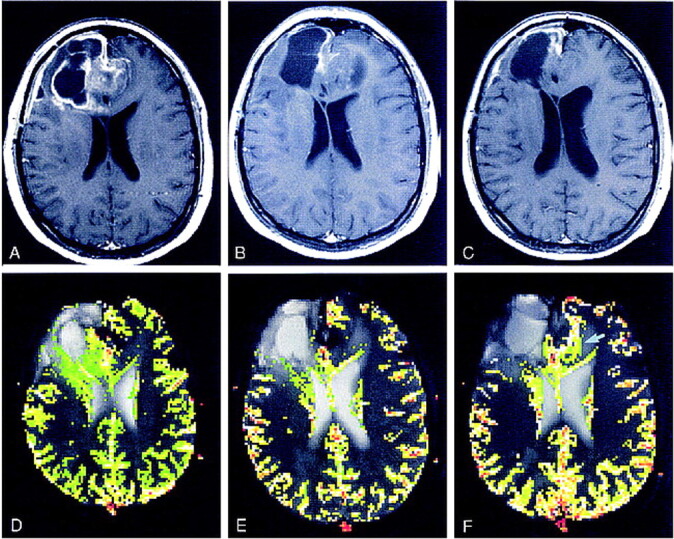
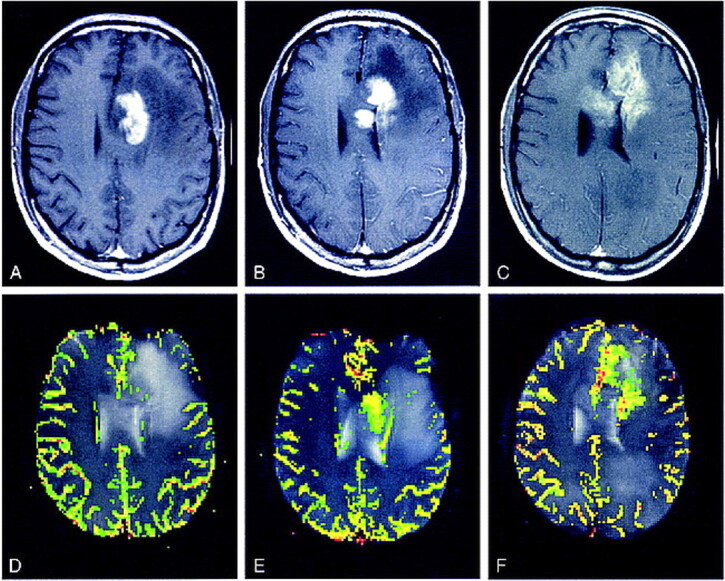
Background and purpose: Dynamic, contrast-enhanced MR imaging has allowed quantitative assessment of cerebral blood volume (CBV) in brain tumors. The purpose of our study was to compare postcontrast T1-weighted imaging with dynamic, contrast-enhanced T2*-weighted echo-planar imaging in the evaluation of the response of recurrent malignant gliomas to thalidomide and carboplatin.

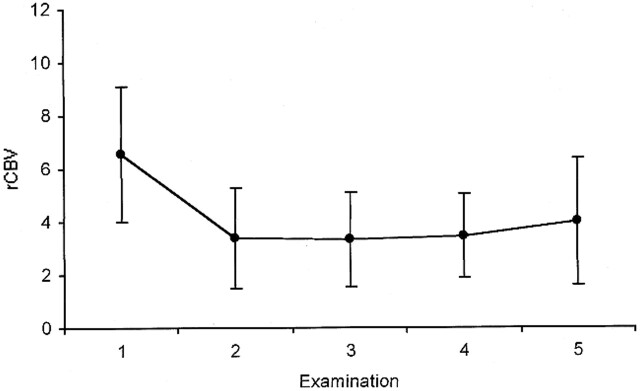
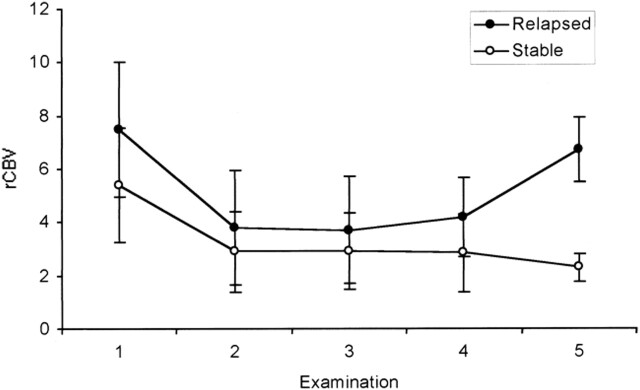
Methods: Serial MR imaging was performed in 18 consecutive patients with recurrent malignant gliomas receiving both thalidomide and carboplatin for 12-month periods. Six patients undergoing carboplatin therapy alone were chosen as control subjects. Conventional postcontrast T1-weighted images were compared with relative CBV (rCBV) maps calculated on a pixel-by-pixel basis from dynamic echo-planar imaging data. Tumor progression was evaluated clinically using established criteria for malignant gliomas. Studies were performed at 2- to 3-month intervals, and imaging and clinical findings were compared.

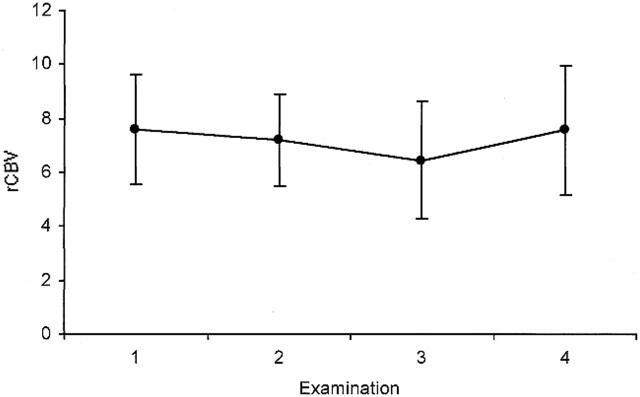
Results: Tumor response to treatment, based on clinical findings, did not correlate well with conventional imaging findings. The rCBV values decreased significantly in all patients between the start of therapy and the first follow-up in the study group, but not in the control group. The difference in rCBV values between the clinically stable and the progressive group at 12-month follow-up was statistically significant, with the progressive group having higher values.

Conclusion: Dynamic, contrast-enhanced MR imaging is a valuable adjunct to conventional imaging in assessing tumor activity during antiangiogenic therapy, and correlates better than conventional studies with clinical status and response to therapy.


Figures

<sc>fig</sc> 1.
fig 1.
Case 12: 58-year-old man with GBM treated with carboplatin and thalidomide, without concomitant steroid therapy. A–C, Postcontrast T1-weighted images. At the start of therapy, an irregularly enhancing mass is seen in the left parietooccipital region (A). At 4-month follow-up, there is mild interval increase in contrast enhancement (B). At 8-month follow-up, a new area of abnormal contrast enhancement is seen in the splenium of the corpus callosum (arrow) as well as lateral periatrial and ventricular involvement (C). D–F, Corresponding color overlay images. At the start of therapy, a focal area of hyperperfusion (arrow) is seen in the lateral aspect of the left parietooccipital tumor (D). At 4-month follow-up, there is interval decrease in the perfusion abnormality in the same region (arrow) (E). At 8-month follow-up, almost complete resolution of the perfusion abnormality is noted in the left parietooccipital lobe (arrow). There is no abnormal perfusion corresponding to the contrast enhancement within the splenium of the corpus callosum. Although conventional imaging findings are consistent with tumor progression, a lack of perfusion abnormality suggests otherwise. The patient was clinically stable at 12- and 16-month follow-up examinations (F).
<sc>fig</sc> 2.
fig 2.
Case 3: 36-year-old man with bifrontal GBM treated with carboplatin and thalidomide, without concomitant steroid therapy. A–C, Postcontrast T1-weighted images. At the start of therapy, a heterogeneous, irregularly enhancing right frontal GBM with areas of necrosis extends into the contralateral frontal lobe (A). At 3-month follow-up, there is a decrease in contrast enhancement within the bifrontal tumor (B). At 7-month follow-up, there is further decrease in contrast enhancement (C). D–F, Corresponding color overlay images. At the start of therapy, a focal area of hyperperfusion is seen in the medial aspect of the right frontal tumor (D). At 3-month follow-up, there is an interval decrease in the perfusion abnormality in the right medial frontal lobe tumor (E). At 7-month follow-up, a new focus of hyperperfusion is seen in the left medial frontal lobe (arrow) without corresponding abnormality on conventional T1-weighted image (F).
<sc>fig</sc> 3.
fig 3.
Case 6: 46-year-old-man with left medial frontal anaplastic oligoastrocytoma treated with carboplatin and thalidomide, without concomitant steroid therapy. A–C, Postcontrast T1-weighted images. At the start of therapy, a solid enhancing mass is seen in the left medial frontal lobe (A). At 3-month follow-up, there is a slight increase in contrast enhancement (B). At 8-month follow-up, there is a less solid and more linear pattern of enhancement (C). D–F, Corresponding color overlay images. At the start of therapy, there is minimal hyperperfusion, corresponding to the left medial frontal enhancing tumor (D). At 3-month follow-up, there is an increase in hyperperfusion (E). At 8-month follow-up, there is further progression of hyperperfusion, corresponding well with patient's deteriorating clinical status (F).
<sc>fig</sc> 4.
fig 4.
Serial rCBV measurements at each follow-up examination for all patients receiving thalidomide and carboplatin. The interval between each examination varied from 2 to 3 months. The first examination was at the start of the therapy and the fifth examination was at the 12-month follow-up. The decrease in rCBV measurements between the initial and first follow-up examination was statistically significant (P = .0014)
<sc>fig</sc> 5.
fig 5.
Serial rCBV measurements for patients receiving carboplatin only. There was no statistically significant change in rCBV during the course of therapy
<sc>fig</sc> 6.
fig 6.
Serial rCBV measurements between the relapsed and the stable groups show a statistically significant difference in rCBV (P = .0161) at the 12-month follow-up (ie, the fifth examination), where the relapsed group had higher values than the stable group
<sc>fig</sc> 7.
fig 7.
Azocarmine stain from a patient (case 7) with recurrent GBM who was treated with carboplatin and thalidomide shows multilayered reduplication of the basal lamina around a microvessel (solid straight arrow). Around this vascular channel, there are several mono- or multinucleated tumor cells (open arrows). Adjacent is a tumor microcyst (curved arrow)

References

    1. Chang SM, Prados MD. Chemotherapy for gliomas. Curr Opin Oncol 1995;7:207-213 - PubMed
    1. Balmaceda C, Fetell MR, Hesdorffer C. Thiotepa and etoposide treatment of recurrent malignant gliomas: phase I study. Cancer Chemother Pharmacol 1997;40:72-74 - PubMed
    1. Friedman HS, Schold SC Jr, Djang WT, et al. Criteria for termination of phase II chemotherapy for patients with progressive or recurrent brain tumor. Neurology 1989;39:62-66 - PubMed
    1. Burger P. Malignant astrocytic neoplasms: classification, pathology, anatomy, and response to therapy. Semin Oncol 1986;13:16-20 - PubMed
    1. D'Amato RJ, Loughnan MS, Flynn E, et al. Thalidomide is an inhibitor of angiogenesis. Proc Natl Acad Sci U S A 1994;91:4082-4085 - PMC - PubMed

Publication types

MeSH terms