. 2000 May;21(5):891-9.

Quantitative measurement of microvascular permeability in human brain tumors achieved using dynamic contrast-enhanced MR imaging: correlation with histologic grade

Affiliations

Quantitative measurement of microvascular permeability in human brain tumors achieved using dynamic contrast-enhanced MR imaging: correlation with histologic grade

H C Roberts et al. AJNR Am J Neuroradiol. 2000 May.

Abstract

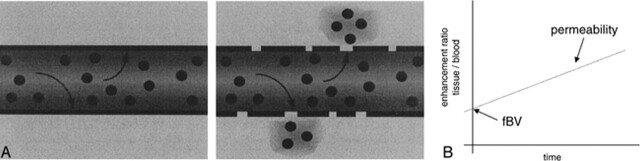
Background and purpose: Dynamic contrast-enhanced MR imaging may be used to quantify tissue fractional blood volume (fBV) and microvascular permeability. We tested this technique in patients with brain tumors to assess whether these measurements correlate with tumor histologic grade.

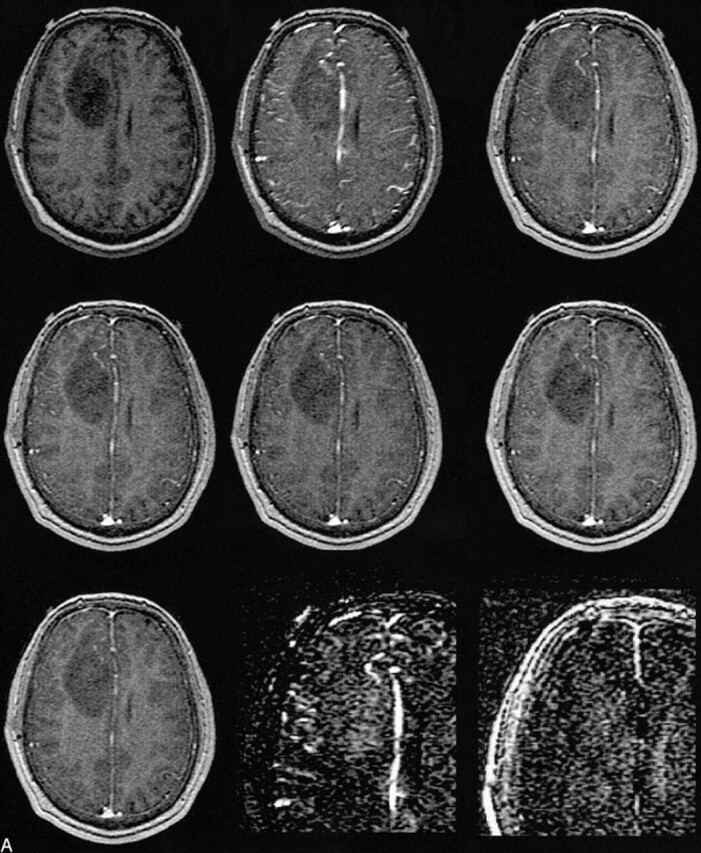
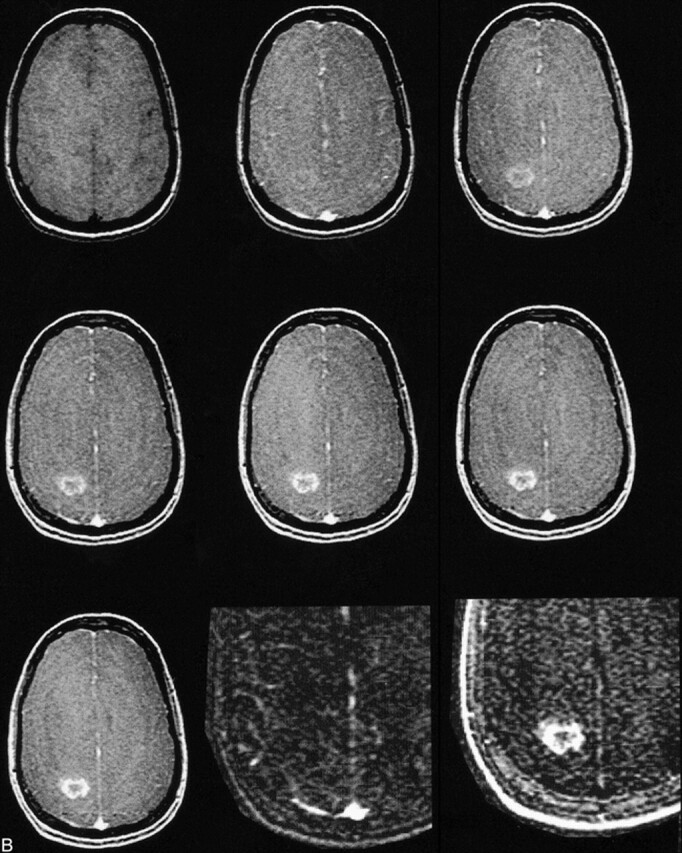
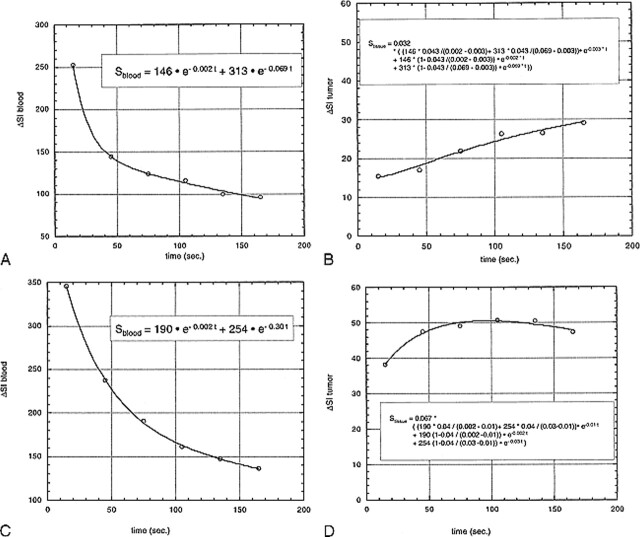
Methods: Twenty-two patients with newly diagnosed gliomas underwent MR imaging followed by surgery. Imaging consisted of one pre- and six dynamic postcontrast 3D spoiled gradient-recalled acquisition in the steady state data sets after administration of a single dose (0.1 mmol/kg) of contrast material. Signal intensity changes in blood and tissue were kinetically analyzed using a bidirectional two-compartment model, yielding estimates of fBV (mL/cm3) and microvascular permeability (mL/100 cm3 per minute). Stained tumor specimens were scored on a four-point scale (1 = low grade, 4 = high grade).

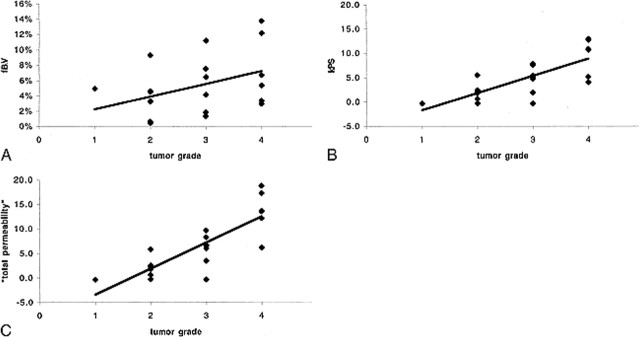
Results: Histologic examination revealed one grade 1, eight grade 2, seven grade 3, and six grade 4 tumors. fBV values ranged from 0.5% to 13.7%. Permeability values ranged from -0.4 to 18.8, with a strong correlation (r = 0.83) to tumor grade. Despite some overlap between the permeability values of specific tumors from different grades, differences in the mean were statistically significant. There was a weak correlation (r = 0.39) between estimated fBV and tumor grade, and no statistically significant difference among fBV values in any of the groups.

Conclusion: This relatively simple method of analysis provides quantitative estimates of fBV and microvascular permeability in human brain tumors, with the permeability being predictive of pathologic grade. The technique can be easily implemented on clinical scanners and may prove useful in the assessment of tumor biology and in therapeutic trials.


Figures

<sc>fig</sc> 1.
fig 1.
A, Schematic representation of two capillaries containing contrast agent. The healthy capillary with an intact BBB (left) is not permeable to the contrast agent, which remains intravascular. A diseased capillary with a disrupted BBB may become permeable to the agent, leading to accumulation of contrast agent outside the vessel (right). B, Because the contrast agent causes relaxation rate enhancement to water in its environment, initial tissue relaxation rate enhancement reflects the fraction of the tissue containing blood vessels (since the contrast agent is, at least initially, confined to the intravascular compartment). The ratio of initial enhancement in tissue to enhancement in a region of 100% blood (eg, the sagittal sinus) will then yield the fBV. Over time, if the contrast agent leaks out of the vessel into the extravascular space of the tissue, the relaxation rate will rise progressively. The rate of increase in relaxation rate is proportional to the permeability of the capillary wall to the contrast agent.
<sc>fig</sc> 2.
fig 2.
A, MR image before contrast administration (top left) and six dynamic contrast-enhanced MR images of a grade 2 oligoastrocytoma. Top center, 15 seconds; top right, 45 seconds; middle left, 75 seconds; middle center, 105 seconds; middle right, 135 seconds; and lower left, 165 seconds after contrast administration. From these seven images, spatial maps of fBV and kPS were determined: fBV (lower center) was estimated as 12.8% in the ventral, enhancing part of the tumor and as 9.3% in the more dorsal part. kPS values (lower right) were 0.31 mL/100 cm3 per minute in the tumor (compared with 0.02 mL/100 cm3 per minute in normal brain tissue)
<sc>fig</sc> 2.
fig 2.
B, MR image before contrast administration (top left) and six dynamic contrast-enhanced MR images of a grade 4 glioblastoma multiforme. Top center, 15 seconds; top right, 45 seconds; middle left, 75 seconds; middle center, 105 seconds; middle right, 135 seconds; and lower left, 165 seconds after contrast administration. From these seven images, spatial maps of fBV and kPS were determined: fBV (lower center) was estimated as 3.0% in the tumor rim and as 0.01% in the core. kPS values (lower right) were 13.6 mL/100 cm3 per minute in the tumor (compared with 0.5 mL/100 cm3 per minute in the core). Times are defined as the time after contrast that the center of k-space (mid-part of 3D acquisition) was attained.
<sc>fig</sc> 3.
fig 3.
A–D, Fitted curves of the ΔSI time course of a typical low-grade (A, B) and a typical high-grade (C, D) tumor. Dynamic postcontrast values for the reference vascular signal (sagittal sinus) are displayed in A and C, respectively, and for tumor curves in B and D, respectively. The equations are displayed on the graphs. The low-grade tumor (patient 8 in Table 1) has an fBV of 3.2%, k1 + k2 is 5.8, and kPS is 5.5; the high-grade tumor (patient 20 in Table 1) has an fBV of 6.7%, k1 + k2 is 13.7, and kPS is 10.8. Times are defined as the time after contrast administration that the center of k-space (mid-part of 3D acquisition) was attained.
<sc>fig</sc> 4.
fig 4.
A–C, Correlation between fBV (A), kPS (B), and total permeability, k, (C) and histologically determined tumor grade. While the data points in A are very scattered, reflective of a weak correlation (r = .39) between fBV and tumor grade, the slope is nonetheless positive, suggesting a tendency toward increased fBV in higher-grade tumors. For kPS, the tendency is more pronounced, with reduced scatter (r = .76). In comparison, total permeability, k, yielded a similar correlation (r = .83), with a steeper slope and less overlap between tumor grade groups.

Comment in

References

    1. Hirata A, Baluk P, Fujiwara T, McDonald DM. Location of focal silver staining at endothelial gaps in inflamed venules examined by scanning electron microscopy. Am J Physiol 1995;269:L403-418 - PubMed
    1. Nugent LJ, Jain RK. Extravascular diffusion in normal and neoplastic tissues. Cancer Res 1984;44:238-244 - PubMed
    1. Jain RK, Gerlowski LE. Extravascular transport in normal and tumor tissues. Crit Rev Oncol Hematol 1986;5:115-170 - PubMed
    1. Jain RK. Vascular and interstitial barriers to delivery of therapeutic agents in tumors. Cancer Metastasis Rev 1990;9:253-266 - PubMed
    1. Brasch R, Pham C, Shames D, et al. Assessing tumor angiogenesis using macromolecular MR imaging contrast media. J Magn Reson Imaging 1997;7:68-74 - PubMed

MeSH terms