Comparative Study
. 2000 Jun;68(6):3314-21.
doi: 10.1128/IAI.68.6.3314-3321.2000.

Antigenic equivalence of human T-cell responses to Mycobacterium tuberculosis-specific RD1-encoded protein antigens ESAT-6 and culture filtrate protein 10 and to mixtures of synthetic peptides

Affiliations
Comparative Study

Antigenic equivalence of human T-cell responses to Mycobacterium tuberculosis-specific RD1-encoded protein antigens ESAT-6 and culture filtrate protein 10 and to mixtures of synthetic peptides

S M Arend et al. Infect Immun. 2000 Jun.

Abstract

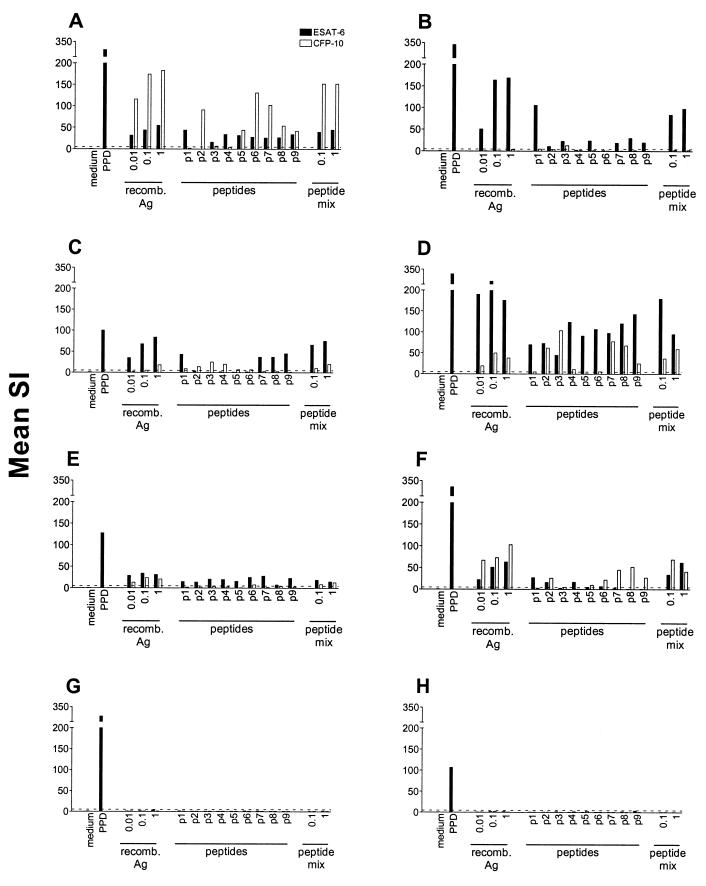
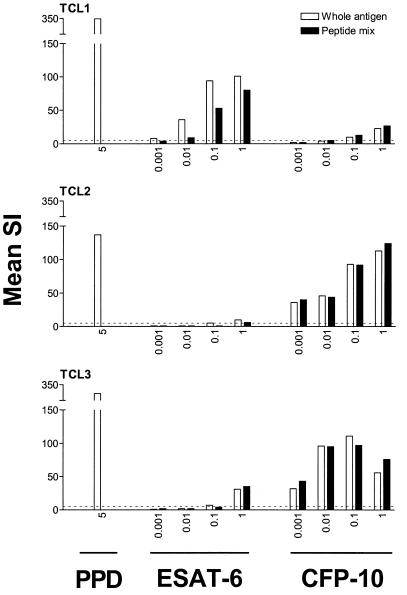
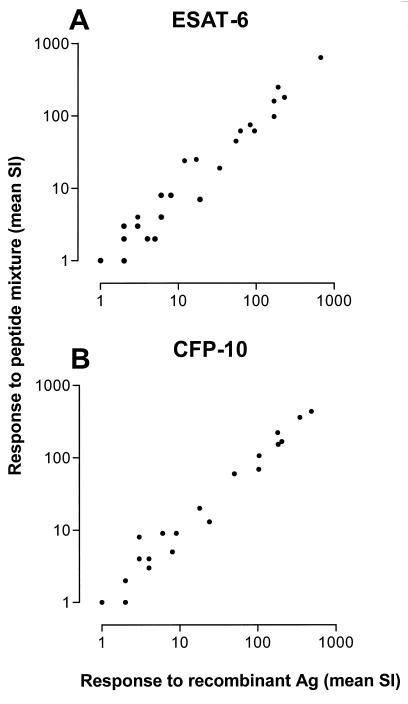
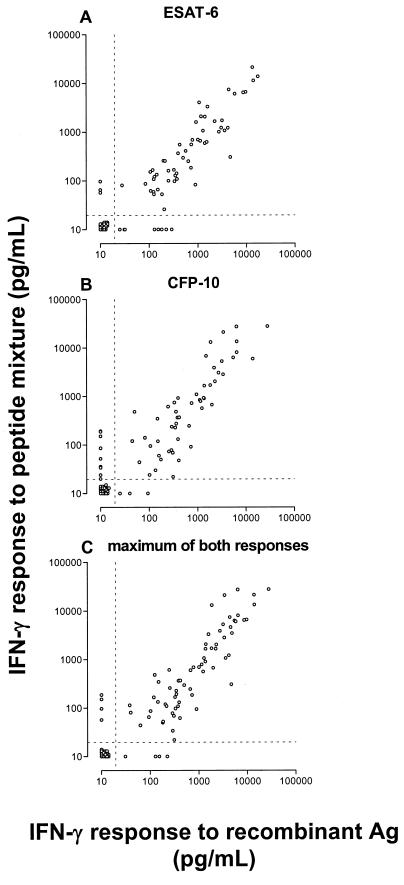
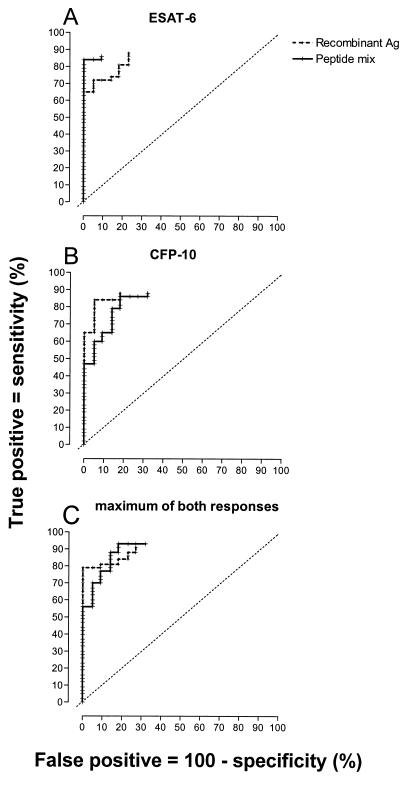
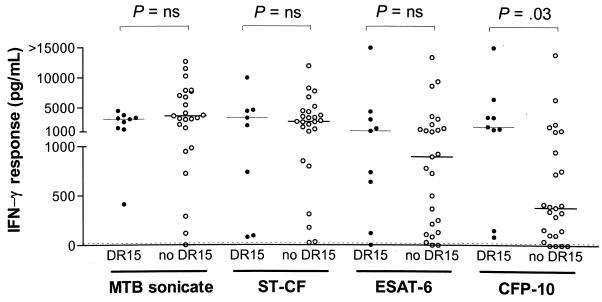
The early secreted antigenic target 6-kDa protein (ESAT-6) and culture filtrate protein 10 (CFP-10) are promising antigens for reliable immunodiagnosis of tuberculosis. Both antigens are encoded by RD1, a genomic region present in all strains of Mycobacterium tuberculosis and M. bovis but lacking in all M. bovis bacillus Calmette-Guérin vaccine strains. Production and purification of recombinant antigens are laborious and costly, precluding rapid and large-scale testing. Aiming to develop alternative diagnostic reagents, we have investigated whether recombinant ESAT-6 (rESAT-6) and recombinant CFP-10 (rCFP-10) can be replaced with corresponding mixtures of overlapping peptides spanning the complete amino acid sequence of each antigen. Proliferation of M. tuberculosis-specific human T-cell lines in response to rESAT-6 and rCFP-10 and that in response to the corresponding peptide mixtures were almost completely correlated (r = 0.96, P < 0.0001 for ESAT-6; r = 0.98, P < 0.0001 for CFP-10). More importantly, the same was found when gamma interferon production by peripheral blood mononuclear cells in response to these stimuli was analyzed (r = 0.89, P < 0.0001 for ESAT-6; r = 0.89, P < 0.0001 for CFP-10). Whole protein antigens and the peptide mixtures resulted in identical sensitivity and specificity for detection of infection with M. tuberculosis. The peptides in each mixture contributing to the overall response varied between individuals with different HLA-DR types. Interestingly, responses to CFP-10 were significantly higher in the presence of HLA-DR15, which is the major subtype of DR2. These results show that mixtures of synthetic overlapping peptides have potency equivalent to that of whole ESAT-6 and CFP-10 for sensitive and specific detection of infection with M. tuberculosis, and peptides have the advantage of faster production at lower cost.


Figures

FIG. 1
FIG. 1
Proliferation of M. tuberculosis-specific T-cell lines with different HLA-DR phenotypes in response to PPD, rESAT-6, rCFP-10, individual peptides, and mixtures of overlapping peptides of these antigens. Antigen concentrations are in micrograms per milliliter. The HLA-DR types of the T-cell lines (A through H) were as follows: A, DR15,17; B, DR13,17; C, DR11; D, DR4,16; E, DR4,17; F, DR15; G, DR11,13; H, DR7,17. For test conditions, see Materials and Methods. Data are expressed as SIs calculated as mean counts per minute in the presence of antigen divided by the mean counts per minute without antigen. A dotted line indicates an SI of 5. p1 to p9, peptides 1 to 9; recomb. Ag, recombinant antigen.
FIG. 2
FIG. 2
Proliferation of M. tuberculosis-specific T-cell lines in response to rESAT-6, rCFP-10, and corresponding peptide mixtures was dose dependent and occurred at similar antigen concentrations of recombinant proteins or peptide mixtures. TCL1 through TCL3 indicate T-cell lines raised from PBMC obtained from different TB patients. A dotted line indicates an SI of 5. For test conditions, see Materials and Methods. Antigen concentrations are in micrograms per milliliter.
FIG. 3
FIG. 3
Proliferation of M. tuberculosis-specific T-cell lines in response to rESAT-6 (A) and rCFP-10 (B) compared to a mixture of synthetic overlapping (20-mer) peptides spanning the complete sequences of the antigens (Ag) correlated almost completely. Highly significant correlations were found between the responses of T-cell lines to rESAT-6 and the peptide mixture (n = 25 T-cell lines; Spearman's r = 0.96; 95% CI, 0.92 to 0.98; P < 0.0001) and between the responses to rCFP-10 and the corresponding peptide mixture (n = 21; r = 0.98; 95% CI, 0.94 to 0.99; P < 0.0001). For test conditions, see Materials and Methods.
FIG. 4
FIG. 4
Levels of IFN-γ production by PBMC in response to rESAT-6 (A) and rCFP-10 (B) and to mixtures of synthetic overlapping peptides (20-mers) spanning the complete amino acid sequences of the antigens were highly correlated (A: Spearman's r = 0.89; 95% CI, 0.84 to 0.93; P < 0.0001) (B: r = 0.89; 95% CI, 0.84 to 0.93; P < 0.0001). The individual maxima of both responses to recombinant antigens (Ag) and those of the responses to the peptide mixtures were correlated to the same great extent (C: r = 0.90; 95% CI, 0.86 to 0.94; P < 0.0001). For test conditions, see Materials and Methods. Dotted lines represent the detection limit of the IFN-γ ELISA (20 pg/ml).
FIG. 5
FIG. 5
ROC curves were constructed from the IFN-γ responses of PBMC to recombinant proteins and the peptide mixtures of ESAT-6 (A), CFP-10 (B), and the individual maxima of both responses (C). This was done by calculating the percentages of true positives (TB patients responding) and false positives (individuals without TB responding) at every possible cutoff value. The ROC curves end blind at a cutoff value equal to the detection limit of the ELISA (20 pg/ml) because in a number of subjects, IFN-γ production was below the detection limit. The slanted dotted lines represent ROC curves of a hypothetical test completely lacking diagnostic value. A perfect diagnostic test would run vertically along the y axis to the upper left corner and then horizontally to the right. The area under the ROC curve, extrapolated to the upper right corner, is directly related to the overall diagnostic value of the assay. Ag, antigen.
FIG. 6
FIG. 6
IFN-γ production by PBMC of TB patients in response to rCFP-10, but not in response to M. tuberculosis (MTB) sonicate, ST-CF, or rESAT-6, was significantly higher in the presence than in the absence of the HLA-DR15 phenotype. ns, not statistically significantly different.

References

    1. Andersen P, Askgaard D, Ljungqvist L, Bennedsen J, Heron I. Proteins released from Mycobacterium tuberculosis during growth. Infect Immun. 1991;59:1905–1910. - PMC - PubMed
    1. Anonymous. Statistical methods in epidemiology. In: Armitage P, Berry G, editors. Statistical methods in medical research. Oxford, England: Blackwell Scientific Publications; 1994. pp. 507–534.
    1. Arend, S. M., P. Andersen, K. E. Van Meijgaarden, R. L. V. Skjøt, Y. W. Subronto, J. T. van Dissel, and T. H. M. Ottenhoff. Sensitive and specific detection of active infection with Mycobacterium tuberculosis by human T cell responses to ESAT-6 and CFP-10. J. Infect. Dis., in press.
    1. Barnes P F, Bloch A B, Davidson P T, Snider D E., Jr Tuberculosis in patients with human immunodeficiency virus infection. N Engl J Med. 1991;324:1644–1650. - PubMed
    1. Beardsley T. Paradise lost? Microbes mount a comeback as drug resistance spreads. Sci Am. 1992;267:18–20. - PubMed

Publication types

MeSH terms