Comparative Study
. 2000 Jun;68(6):3523-34.
doi: 10.1128/IAI.68.6.3523-3534.2000.

Genetic relatedness and superantigen expression in group A streptococcus serotype M1 isolates from patients with severe and nonsevere invasive diseases

Affiliations
Comparative Study

Genetic relatedness and superantigen expression in group A streptococcus serotype M1 isolates from patients with severe and nonsevere invasive diseases

S Chatellier et al. Infect Immun. 2000 Jun.

Abstract

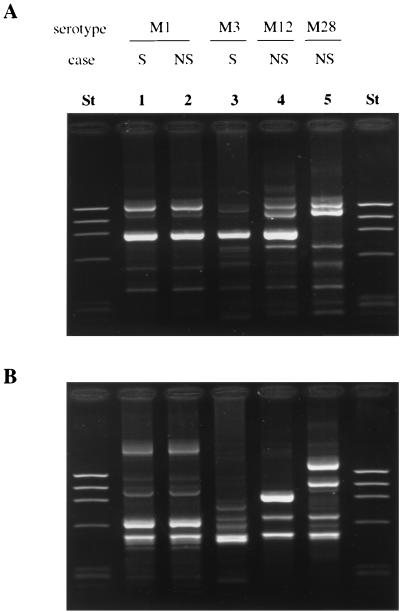
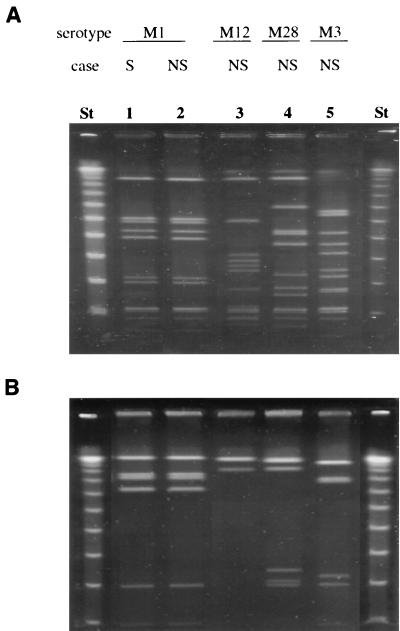
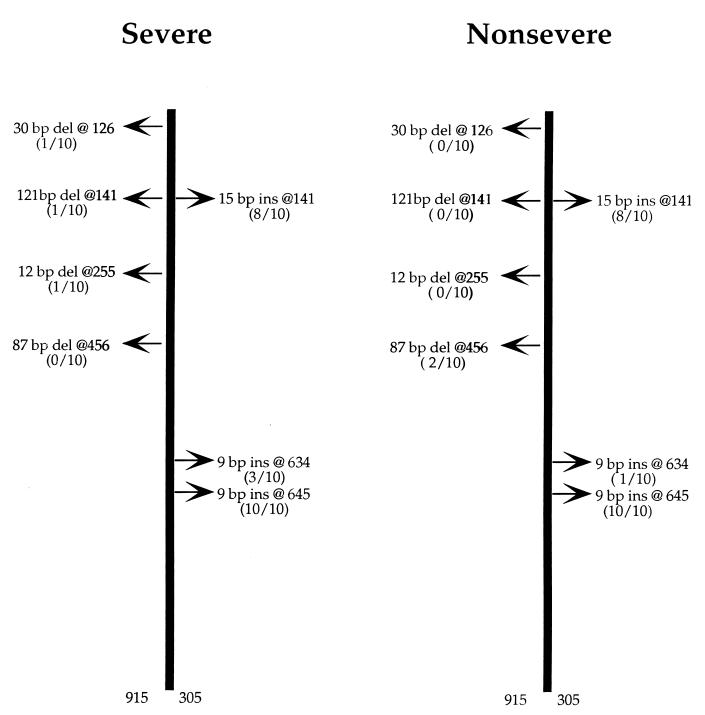
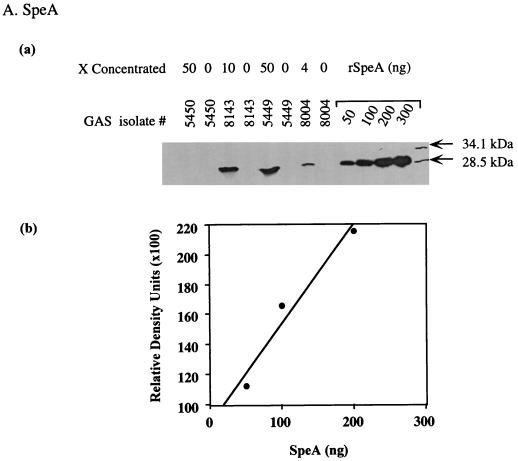
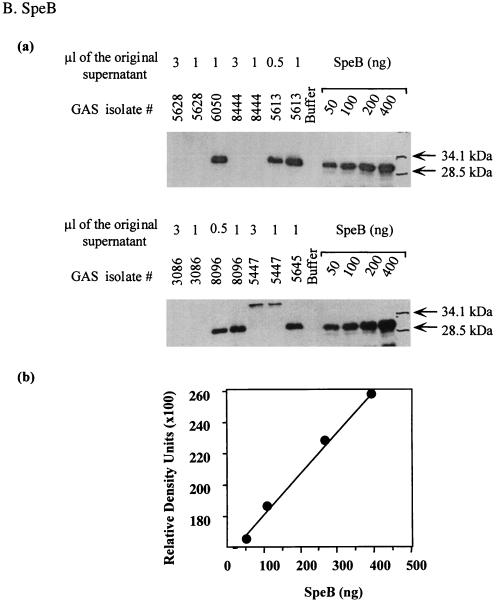
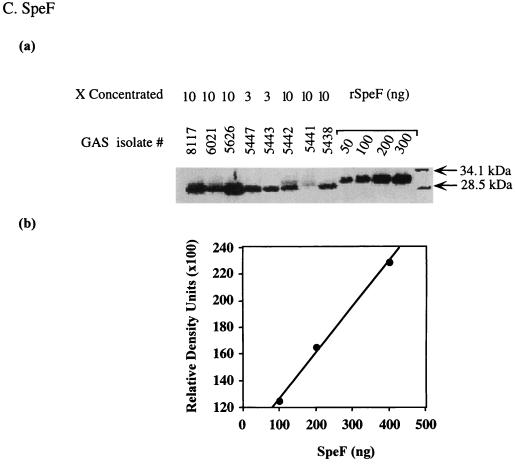
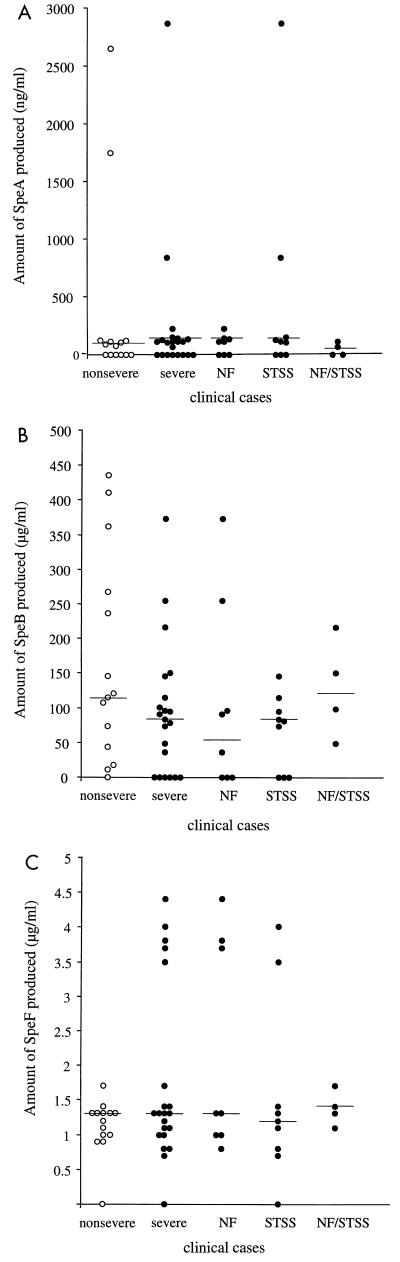
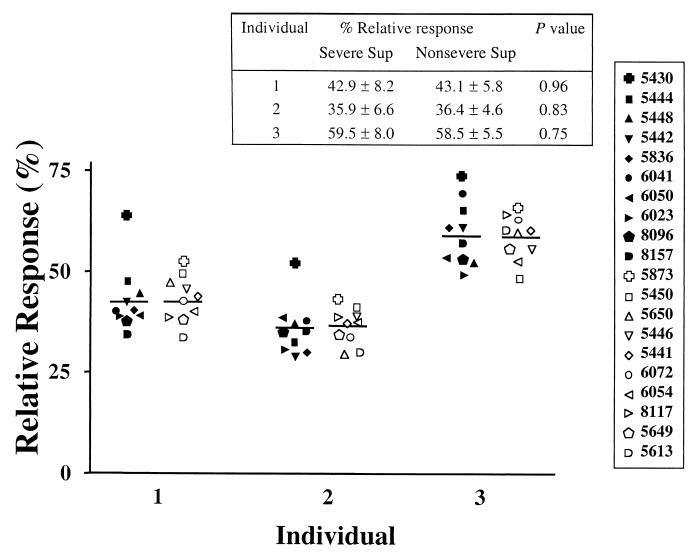
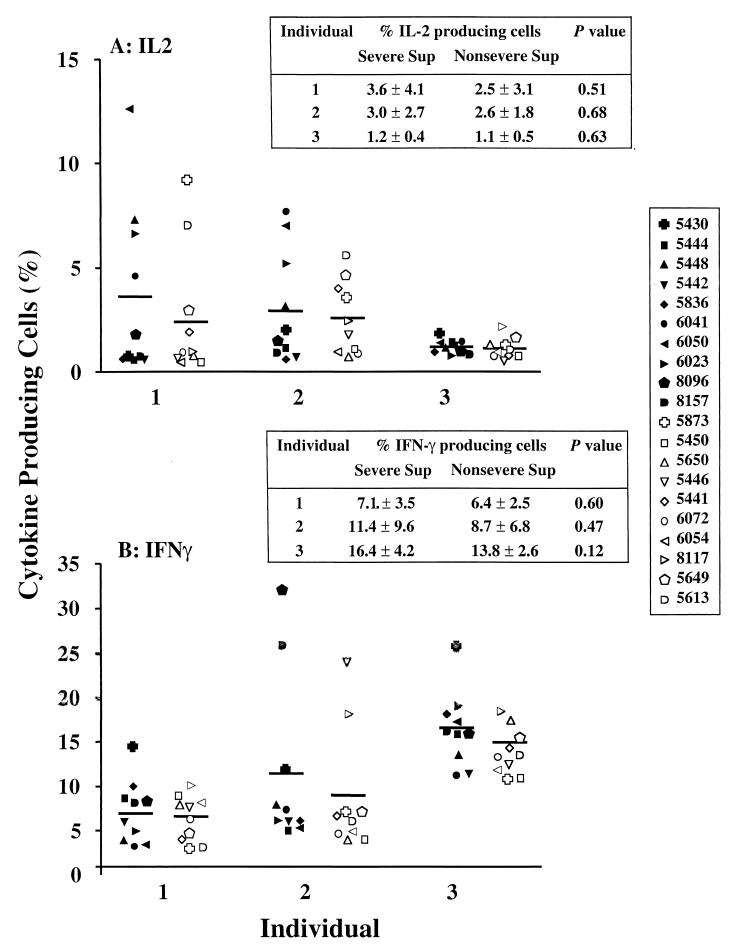
The relatedness of group A streptococcal (GAS) strains isolated from 35 Canadian patients with invasive disease of different severity was investigated by a variety of molecular methods. All patients were infected with M1T1 strains and, based on clinical criteria, were classified as severe (n = 21) and nonsevere (n = 14) invasive GAS infection cases. All the M1 strains studied had the emm1.0 allele and the same streptococcal pyrogenic exotoxin (Spe) genotype, speA(+) speB(+) speC speF(+) speG(+) speH smeZ(+) ssa. All isolates had the same speA allotype, speA2. The randomly amplified polymorphic DNA banding pattern with two different primers was identical for all strains, and pulsed field gel electrophoresis analysis showed that 33 and 30 isolates had identical banding patterns after DNA digestion with SfiI or SmaI, respectively; the nonidentical isolates differed from the main pattern by only one band. A relatively high degree of polymorphism in specific regions of the sic gene was observed among isolates; however, this polymorphism was not associated with disease severity. Likewise, although the phenotypic expression of SpeA, SpeB, and SpeF proteins varied among the M1T1 isolates, there was no correlation between the amount of Spe expressed and disease severity. Importantly, mitogenic and cytokine responses induced by partially purified bacterial culture supernatants containing a mixture of expressed superantigens were very similar for isolates from severe and nonsevere cases (P > 0.1). Together, the data indicate that highly related invasive M1T1 isolates, some indistinguishable, can cause disease of varying severity in different individuals. These findings underscore the contribution of host factors to the outcome of invasive GAS infections.


Figures

FIG. 1
FIG. 1
RAPD analysis of GAS isolates. RAPD was performed with primers P1 and P5. (A) Patterns obtained with primer P1; (B) patterns obtained with primer P5. Lanes St, lambda ladder used as molecular size markers; lanes 1 and 2, isolates of serotype M1T1; lane 3, M3 isolate; lane 4, M12 isolate; lane 5, M28 isolate. S, strain from severe invasive case; NS, strain from nonsevere invasive case.
FIG. 2
FIG. 2
Representative PFGE patterns of different GAS isolates. Chromosomal DNA was digested with the restriction endonuclease SmaI (A) or SfiI (B). Lanes St, lambda ladder used as molecular size markers. Lanes 1 and 2, isolates of serotype M1T1; lane 3, M12 isolate; lane 4, M28 isolate; lane 5, M3 isolate. S, strain from severe invasive case; NS, strain isolated from nonsevere invasive case.
FIG. 3
FIG. 3
Nucleotide insertions and deletions identified in the sic gene of selected M1T1 isolates. The sic gene was completely sequenced in 20 selected isolates (10 from severe cases and 10 from nonsevere cases). Deletions (del) and insertions (ins) are with reference to the sequence of the sic allele deposited in the GenBank database (accession no. X92968). Among the severe isolates, one had a 30-bp deletion at 126, and another isolate had two deletions at 141 (121 bp) and 255 (12 bp). Among the nonsevere isolates, two isolates showed an 87-bp deletion at 456. All isolates showed an insertion of 9 bp at 645, and with the exception of two isolates from each group, all isolates showed an insertion of 15 bp at 141. A third insertion of 9 bp at 634 was seen in two isolates from the severe group and one from the nonsevere group.
FIG. 4
FIG. 4
Method for measurement of Spe production in the culture supernatant of GAS isolates. Bacterial culture supernatants were prepared as described in Materials and Methods and subjected to Western blot analysis. To allow quantification of Spe production, each gel contained serial dilutions of standard amounts of rSpeA (50 to 300 ng) or purified SpeB (50 to 400 ng) or rSpeF (50 to 300 ng) along with the unknown test samples. The blots were sequentially probed with specific Ab to each Spe tested and subjected to autoradiography, and the bands corresponding to the specific Spe being analyzed were visualized. The amount of Spe produced in each supernatant was quantified from a standard curve generated by scanning values of known concentrations of standards that were included in the same gel.
FIG. 4
FIG. 4
Method for measurement of Spe production in the culture supernatant of GAS isolates. Bacterial culture supernatants were prepared as described in Materials and Methods and subjected to Western blot analysis. To allow quantification of Spe production, each gel contained serial dilutions of standard amounts of rSpeA (50 to 300 ng) or purified SpeB (50 to 400 ng) or rSpeF (50 to 300 ng) along with the unknown test samples. The blots were sequentially probed with specific Ab to each Spe tested and subjected to autoradiography, and the bands corresponding to the specific Spe being analyzed were visualized. The amount of Spe produced in each supernatant was quantified from a standard curve generated by scanning values of known concentrations of standards that were included in the same gel.
FIG. 5
FIG. 5
Comparison of amounts of SpeA, SpeB, and SpeF in culture supernatant of GAS isolates from severe and nonsevere invasive cases. SpeA, SpeB, and SpeF toxins were detected by Western blot and quantified after scanning the autoradiograms as detailed in the legend to Fig. 3 and in Materials and Methods. The amount of each Spe was calculated from a standard curve generated by scanning values of known amounts of standards included in each run, as detailed in the legend to Fig. 3. Horizontal lines denote median values of Spe production from severe and nonsevere cases.
FIG. 6
FIG. 6
Mitogenic activity of culture supernatants of M1T1 isolates. PBMCs from three healthy individuals were stimulated with sterile culture supernatants (1:100 dilution) prepared from 20 different M1T1 GAS strains (10 each from severe and nonsevere cases). Different symbols are used for each isolate; solid symbols are for severe and open symbols are for nonsevere isolates. Proliferative responses were assessed after 72 h of culture, after a 6-h [3H]thymidine pulse. The data are presented as percent relative response as defined in the text. Horizontal lines denote mean values for culture supernatants from severe and nonsevere cases.
FIG. 7
FIG. 7
Cytokine-inducing activity of culture supernatants of M1T1 isolates from severe versus nonsevere cases. PBMCs from three healthy individuals were stimulated with culture supernatants (1:100) prepared from 20 different M1T1 GAS strains (10 each from severe and nonsevere cases). Different symbols are used for each isolate; solid symbols are for severe and open symbols are for nonsevere isolates. Cells were harvested after 24 h for analyses of IL-2 production (A) and after 72 h for IFN-γ production (B). Horizontal lines denote mean values of culture supernatants from severe and nonsevere cases.

References

    1. Akesson P, Sjoholm A G, Bjorck L. Protein SIC, a novel extracellular protein of Streptococcus pyogenes interfering with complement function. J Biol Chem. 1996;271:1081–1088. - PubMed
    1. Andersson J, Nagy S, Bjork L, Abrams J, Holm S E, Andersson U. Bacterial toxin-induced cytokine production studied at a single cell level. Immunol Rev. 1992;127:69–96. - PubMed
    1. Basma H, Norrby-Teglund A, Guedez Y, McGeer A, Low D E, El-Ahmedy O, Schwartz B, Kotb M. Risk factors in the pathogenesis of invasive group A streptococcal infections: role of protective humoral immunity. Infect Immun. 1999;67:1871–1877. - PMC - PubMed
    1. Beachey E H, Seyer J M. Primary structure and immunochemistry of group A streptococcal M proteins. Semin Infect Dis. 1982;4:401–410.
    1. Chaussee M S, Liu J, Stevens D L, Ferretti J J. Genetic and phenotypic diversity among isolates of Streptococcus pyogenes from invasive infections. J Infect Dis. 1996;173:901–908. - PubMed

Publication types

MeSH terms