. 2000 Jun 1;20(11):4037-49.
doi: 10.1523/JNEUROSCI.20-11-04037.2000.

Functional consequences of reduction in NMDA receptor glycine affinity in mice carrying targeted point mutations in the glycine binding site

Affiliations

Functional consequences of reduction in NMDA receptor glycine affinity in mice carrying targeted point mutations in the glycine binding site

J N Kew et al. J Neurosci. .

Abstract

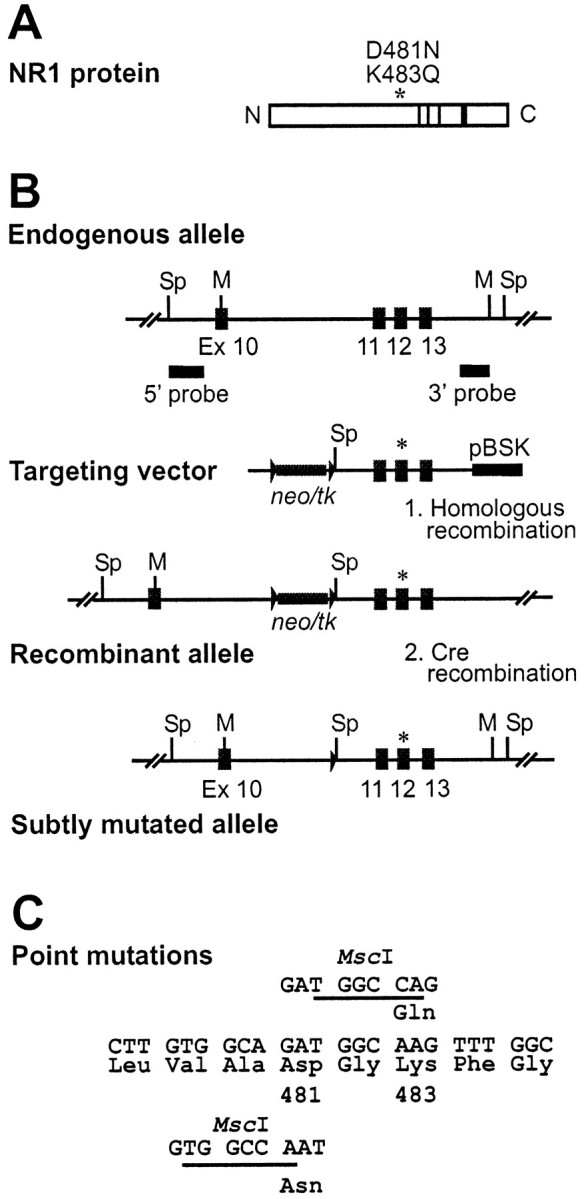
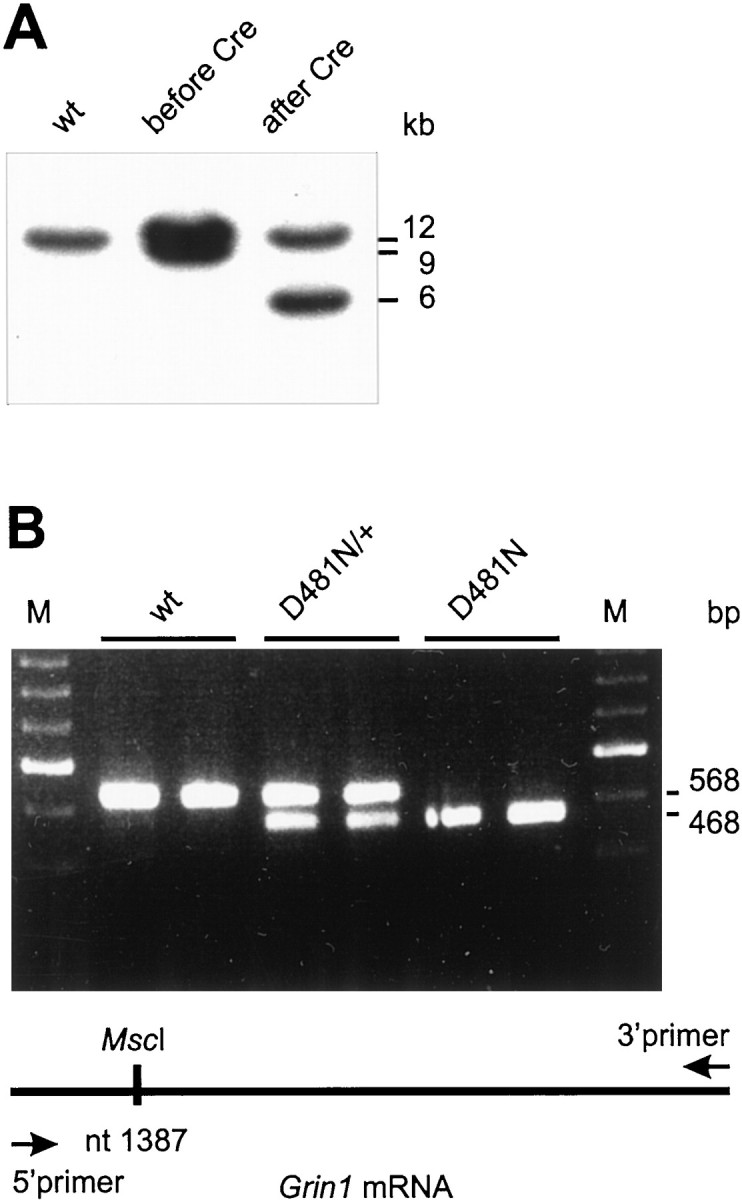
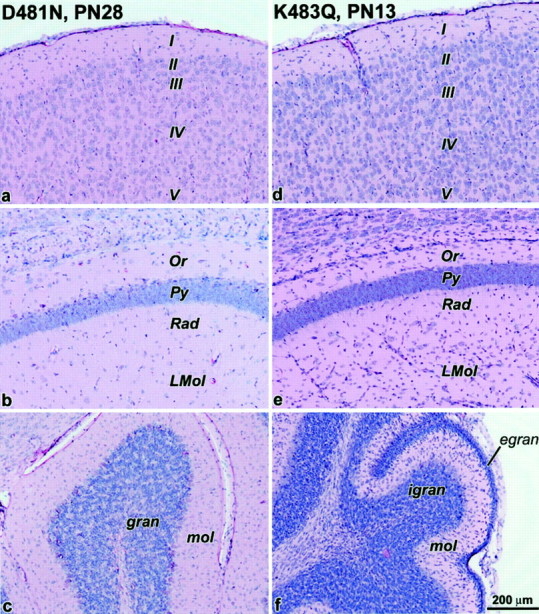
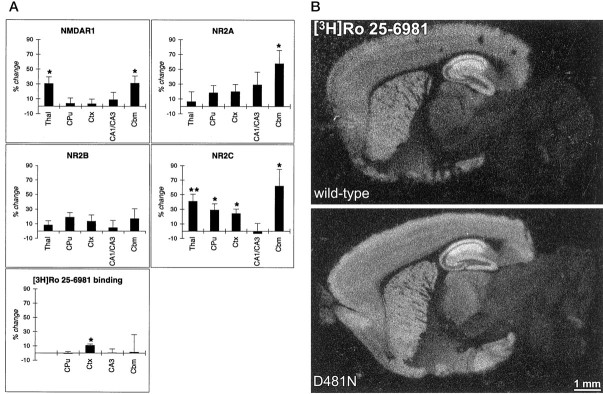
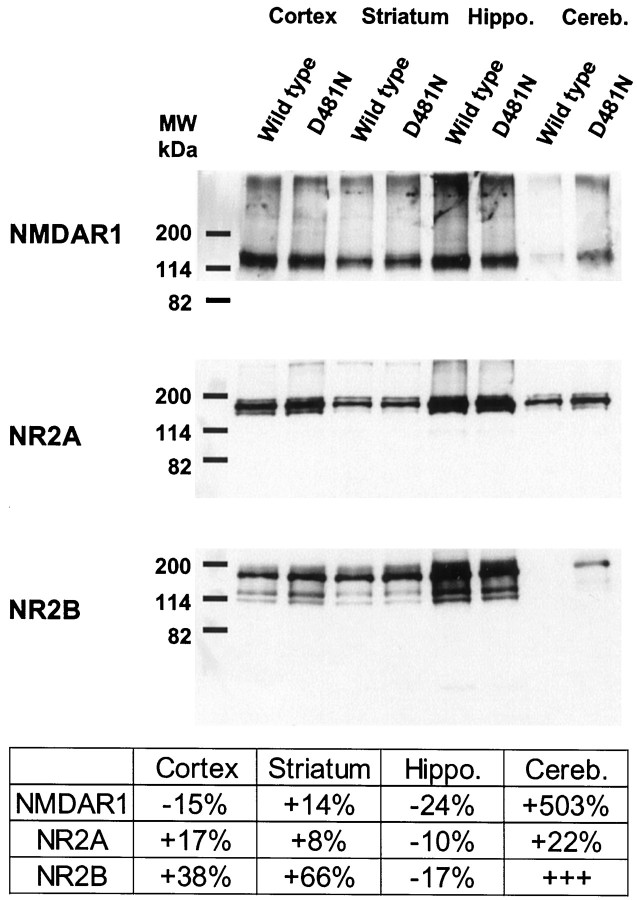
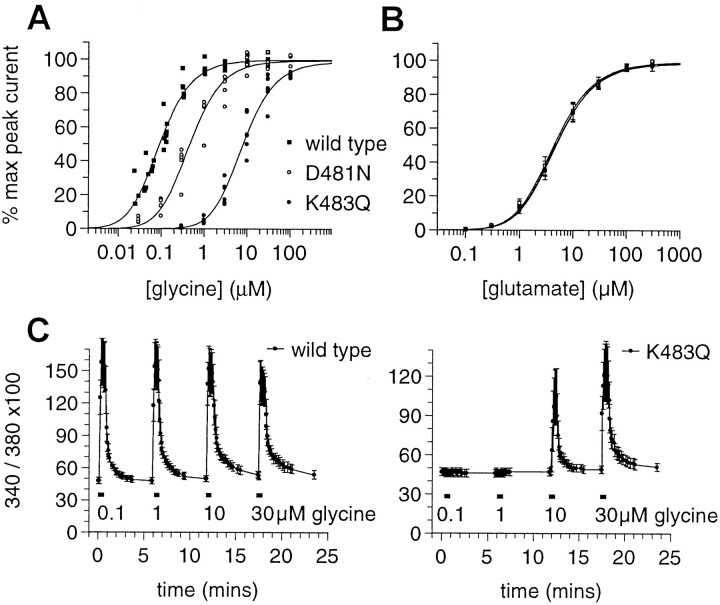
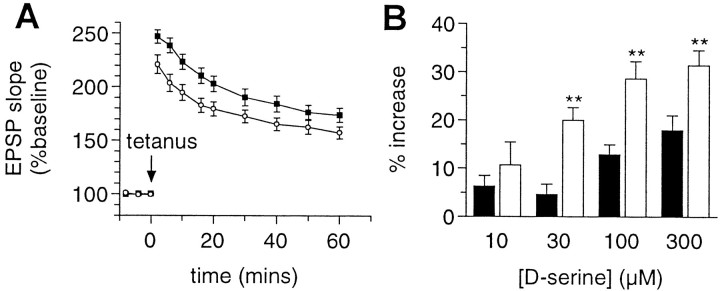
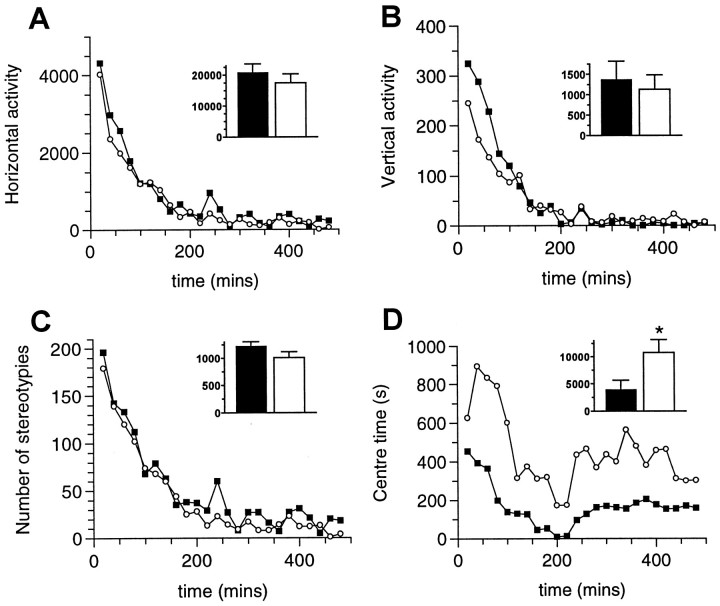
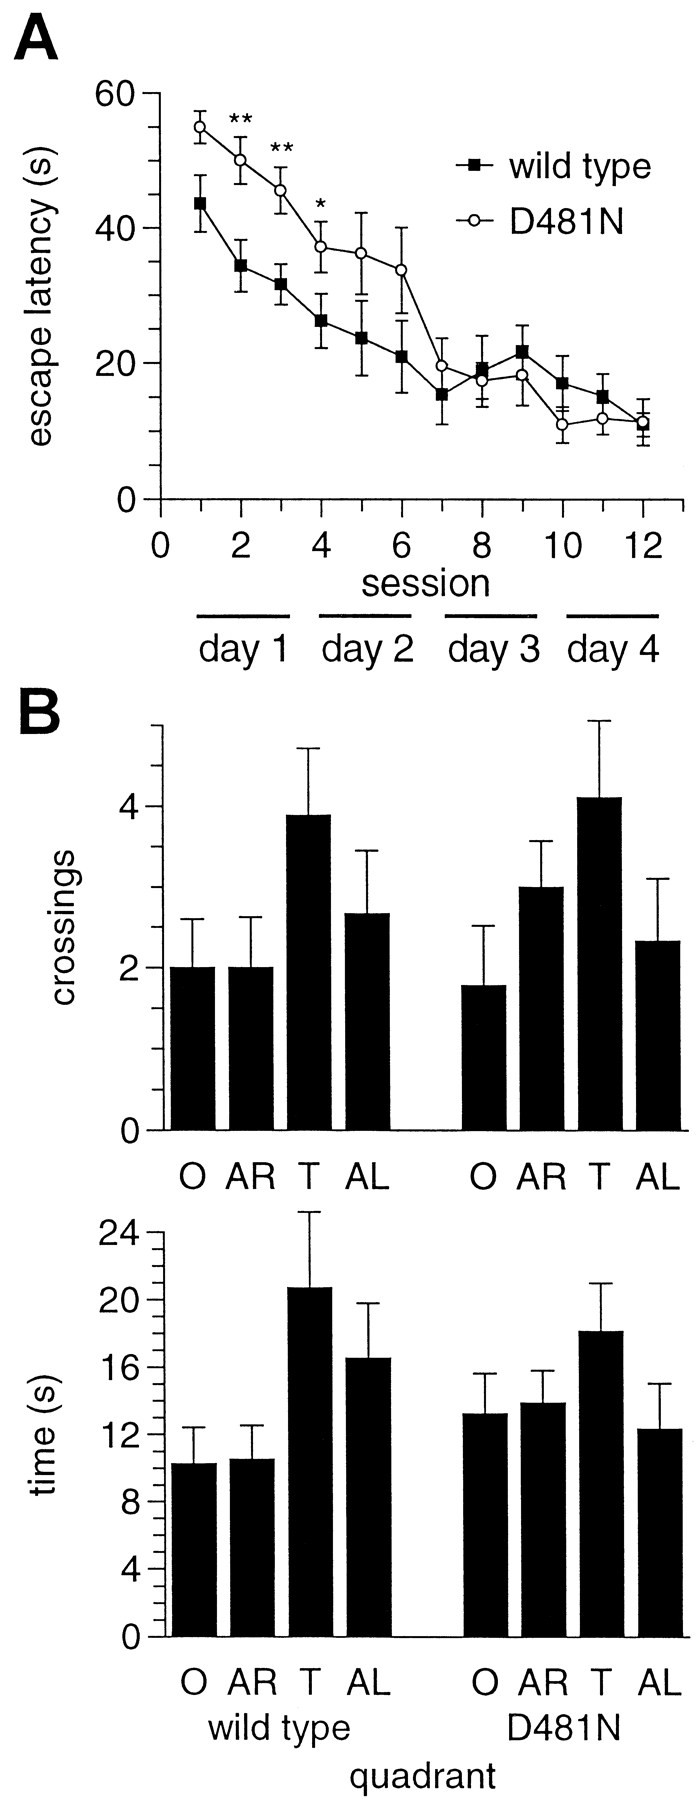
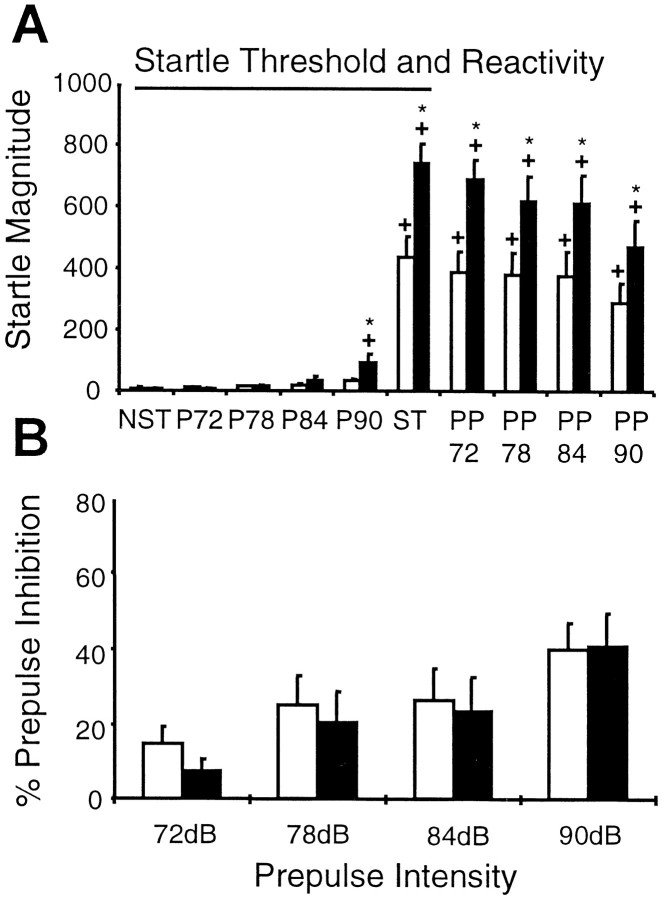
We have used site-directed mutagenesis in conjunction with homologous recombination to generate two mouse lines carrying point mutations in the glycine binding site of the NMDAR1 subunit (Grin1). Glycine concentration-response curves from acutely dissociated hippocampal neurons revealed a 5- and 86-fold reduction in receptor glycine affinity in mice carrying Grin1(D481N) and Grin1(K483Q) mutations, respectively, whereas receptor glutamate affinity remained unaffected. Homozygous mutant Grin1(D481N) animals are viable and fertile and appear to develop normally. However, homozygous mutant Grin1(K483Q) animals are significantly lighter at birth, do not feed, and die within a few days. No gross abnormalities in CNS anatomy were detected in either Grin1(D481N) or Grin1(K483Q) mice. Interestingly, in situ hybridization and Western blot analysis revealed changes in the expression levels of NMDA receptor subunits in Grin1(D481N) mice relative to wild type that may represent a compensatory response to the reduction in receptor glycine affinity. Grin1(D481N) mice exhibited deficits in hippocampal theta burst-induced long-term potentiation (LTP) and spatial learning and also a reduction in sensitivity to NMDA-induced seizures relative to wild-type controls, consistent with a reduced activation of NMDA receptors. Mutant mice exhibited normal prepulse inhibition but showed increased startle reactivity. Preliminary analysis indicated that the mice exhibit a decreased natural aversion to an exposed environment. The lethal phenotype of Grin1(K483Q) animals confirms the critical role of NMDA receptor activation in neonatal survival. A milder reduction in receptor glycine affinity results in an impairment of LTP and spatial learning and alterations in anxiety-related behavior, providing further evidence for the role of NMDA receptor activation in these processes.


Figures

Fig. 1.
Fig. 1.
Targeted point mutation of the glycine binding site of the Nmdar1 gene (Grin1).A, Schematic representation of the NMDAR1 protein of 938 amino acids in size showing the N and Ctermini and the four putative transmembrane domains as solid bars. An asterisk indicates the location of amino acids 481 and 483, which were mutated. B, Homologous recombination and subsequent Cre-mediated recombination of the Grin1 gene in ES cells. The relevant genomic structure and partial restriction map of the Grin1 gene spanning exons 10–13 is given on top (numbering according to Hollmann et al., 1993). The locations of the 5′ and 3′ probes used for Southern blot analysis are indicated below. Targeting vectors pNR1 481 and 483 neotkflox carry the D481N and K483Q mutation in exon 12, respectively, as marked with an asterisk, which creates an additional MscI restriction site. The neomycin resistance (neo) and HSV–thymidine kinase (tk) cassette used for selection is located in the intron between exons 10 and 11 and is flanked with twoloxP sites in the same orientation. The solid bar at the 3′ end indicates residual vector sequences of pBluescript (Stratagene, Basel, Switzerland). The recombinant allele after homologous recombination carries the floxed neo/tkcassette and the respective point mutation in exon 12 as indicated by the asterisk. After Cre-recombination, the floxedneo/tk cassette is excised, leaving oneloxP site behind in the intron and the point mutation in exon 12 unchanged. Restriction sites used for Southern blot analysis:Sp, SpeI; M,MscI; X, XbaI.C, Base pair exchanges introduced in exon 12 by the targeting vector coding for amino acid exchanges D481N and K483Q, respectively (numbering according to Wafford et al., 1995).
Fig. 2.
Fig. 2.
A, Southern blot analysis of ES cell clones. DNA from wild-type ES cells and a targeted ES cell clone before and after Cre-recombination was digested withSpeI and hybridized with the 5′ probe. The 9 kb fragment represents the homologous recombined allele containing theneo/tk cassette. This fragment is shortened to 6 kb after Cre-mediated excision of the resistance cassette. DNA from both Grin1D481N- andGrin1K483Q-targeted ES cells gives an indistinguishable pattern in Southern blot analysis attributable to the almost identical location of the point mutation in the Grin1 gene. B, RT-PCR and mutation-specific restriction enzyme analysis. Total RNA isolated from whole mouse brains of different genotypes of both mutations was used as a template for cDNA synthesis. The 5′ primer used forGrin1-specific PCR amplification starts at nt 1287, and the 3′ primer starts at nt 1855. The position of the mutation-specificMscI site is nt 1387 for D481N (bottom panel) and nt 1393 for K483Q (data not shown). The amplified fragments after restriction digestion withMscI are depicted in the top panel. Wild-type (wt) fragments are resistant to digestion, whereas half of the fragments from heterozygous D481N animals (D481N/+) are shortened, giving two bands of 568 and 468 bp, respectively. All fragments from homozygous D481N mutant animals (D481N), however, are digested to the smaller band. cDNA from Grin1K483Qmice displayed the same pattern after MscI digestion because of the proximity of both point mutations (data not shown).
Fig. 3.
Fig. 3.
Bright-field images of hematoxylin/eosin-stained brain sections from Grin1D481Nand Grin1K483Qmice. No morphological abnormalities were apparent for either 28-d-oldGrin1D481Nor 13-d-oldGrin1K483Qmice in the cerebral cortex (a, d), hippocampal CA1 region (b, e), and cerebellum (c,f), respectively. I–V, Cortical layers; Or, oriens layer of CA1; Py, pyramidal layer of CA1; Rad, radiatum layer of CA1;Lmol, lacunosum moleculare layer of CA1;gran, granule cell layer of cerebellum;egran, external granule cell layer;igran, internal granule cell layer; mol, molecular layer of cerebellum.
Fig. 4.
Fig. 4.
In situ hybridization and receptor autoradiography analysis of NMDA receptor subunit expression in wild-type and Grin1D481N mice.A, Percentage change (mean ± SE) in NMDA receptor subunit mRNA hybridization signal and [3H]Ro 25-6981 binding in brains of Grin1D481Nmice versus controls revealed by quantitative radioautography and image analysis (*p < 0.05, **p < 0.01, two-tailed t test).B, Regional distribution of in vitrobinding sites for [3H]Ro 25-6981 (selective for NMDA receptors containing NR2B) in parasagittal brain sections of wild-type and Grin1D481Nmice revealed by receptor radioautography. White areasindicate high levels of binding.
Fig. 5.
Fig. 5.
Expression of NMDAR1, NR2A, and NR2B protein in the cortex, striatum, hippocampus, and cerebellum of wild-type andGrin1D481N mice revealed by Western blot analysis. Optical densities of the protein bands fromGrin1D481Nmice are expressed relative to the values obtained from respective brain regions in wild-type animals.
Fig. 6.
Fig. 6.
Glycine and glutamate concentration–response data from wild-type, Grin1D481N, and Grin1K483Q mice. A, Plot of the glycine concentration–response curves from acutely dissociated hippocampal neurons from wild-type,Grin1D481N, andGrin1K483Q mice. Curves fitted with the two-equivalent binding site model yieldedmKD values of 0.038, 0.19, and 3.26 μm, respectively. Inward currents were elicited in response to 2 sec applications of 100 μm NMDA at 29 sec intervals in the presence of increasing concentrations of glycine. Peak current–response amplitudes were normalized to the respective maximum peak response derived from a fitted curve of the peak glycine concentration–response data for each individual neuron using the two-equivalent binding site model. B, Glutamate concentration–response curves from acutely dissociated hippocampal neurons from wild-type, Grin1D481N, andGrin1K483Q mice. Curves fitted with the two-equivalent binding site model yieldedmKD values of 1.9, 1.8, and 2 μm, respectively. Inward currents were elicited at 29 sec intervals in response to 2 sec applications of increasing concentrations of glutamate in the continuous presence of 30 μm glycine and 10 μm NBQX. Mean ± SE peak currents have been normalized to the respective maximum peak response derived from a fitted curve of the peak glutamate concentration–response data for each individual neuron using the two-equivalent binding site model. C, Effect on intracellular Ca2+, as measured by fura-2 imaging, of stimulation of neurons with NMDA (100 μm) and variable concentrations of glycine. Cortical neurons from single rat embryos were stimulated with NMDA (100 μm) plus variable concentrations of glycine as indicated for 30 sec; stimuli were separated by 5 min washes. The ratio values of 340/380 (100×) from representative experiments are shown as means ± SD (wild type: n = 17;Grin1K483Q: n = 34).
Fig. 7.
Fig. 7.
Theta burst-induced LTP in wild-type andGrin1D481N mice.A, Hippocampal slices (400 μm) from wild-type (solid squares, n = 10) and Grin1D481N mice (open circles, n = 10) were maintained in an interface chamber at 35°C, and fEPSPs were elicited by stimulation of the Schaffer collateral/commissural afferents (100 μsec, 0.05 Hz) and recorded in the CA1 stratum radiatum. LTP was induced using a TBS paradigm. Mean ± SE fEPSP slopes are expressed as a percentage of baseline values recorded 10 min before TBS. B, NMDA-evoked population depolarizations of cortical slices from wild-type (solid bars, n = 6–13) and Grin1D481Nmice (open bars, n = 14). Mean ± SE depolarizations produced by application of 20 μmNMDA in the presence of increasing concentrations ofd-serine are expressed as a percentage increase relative to the depolarization evoked by 20 μm NMDA alone in each individual slice (i.e., 20 μm NMDA alone = 0%). The relative increase in response amplitude after addition of 30, 100, and 300 μmd-serine was significantly greater in slices fromGrin1D481Nmice compared with wild type (**p < 0.01, two-tailed ttest).
Fig. 8.
Fig. 8.
Locomotor activity and number of stereotypies in wild-type andGrin1D481N mice. Locomotor activity profile of wild-type (solid squares) andGrinD481Nmice (open circles) measured in the Omnitech apparatus. Groups of eight mice per group were used. The locomotor activity profile was recorded for 8 hr. The figure shows horizontal activity (A), vertical activity (B), number of stereotypies (C), and center time (D). Inset bar graphs represent the cumulative values for 8 hr (*p < 0.05, two-tailed t test).
Fig. 9.
Fig. 9.
Spatial learning in the Morris water maze in wild-type and Grin1D481Nmice. A,Grin1D481N(n = 9) and wild-type (n = 10) mice were trained for 4 d with three sessions per day and three trials per session. The mean ± SE time to reach the hidden platform in the pool (escape latency) was plotted against the training session (*p < 0.05, **p < 0.01, ANOVA). B, After the final trial on day 4, the platform was removed, and mice were allowed to swim freely for 60 sec. Mean ± SE time spent in each quadrant and the mean ± SE number of crossings over the platform position are shown for wild-type and Grin1D481Nanimals. T, Target quadrant; O, opposite; AR, adjacent right; AL, adjacent left.
Fig. 10.
Fig. 10.
Magnitude and prepulse inhibition of the acoustic startle response in wild-type andGrin1D481N mice.  A, Magnitude (mean ± SE) of the startle response to various acoustic stimuli (NST: no stimulus, 68 dB background noise; P72–P90: acoustic stimuli of 72–90 dB; ST: 110 dB stimulus; PP72–PP90: 110 dB stimulus preceded by a prepulse of 72–90 dB). Wild-type mice =open bars (n = 12);Grin1D481Nmice =closed bars (n = 11). +indicates statistically significant difference as compared with NST (p < 0.05, Fisher's PLSD test). * indicates statistically significant difference between wild-type andGrin1D481Nmice (p < 0.05 Fisher's PLSD test).B, Percentage prepulse inhibition (mean ± SE) of the acoustic startle response at various prepulse intensities in wild-type and Grin1D481Nmice.

References

    1. Anson LC, Chen PE, Wyllie DJA, Colquhoun D, Schoepfer R. Identification of amino acid residues of the NR2A subunit that control glutamate potency in recombinant NR1/NR2A NMDA receptors. J Neurosci. 1998;18:581–589. - PMC - PubMed
    1. Bakshi VP, Geyer MA. Multiple limbic regions mediate the disruption of prepulse inhibition produced in rats by the non-competitive NMDA antagonist dizolcilpine. J Neurosci. 1998;18:8394–8401. - PMC - PubMed
    1. Bakshi VP, Tricklebank M, Neijt HC, Lehmann-Masten V, Geyer MA. Disruption of prepulse inhibition and increases in locomotor activity by competitive N-methyl-d-aspartate receptor antagonists in rats. J Pharmacol Exp Ther. 1999;288:643–652. - PubMed
    1. Baron BM, Harrison BL, Kehne JH, Schmidt CJ, van Giersbergen PL, White HS, Siegel BW, Senyah Y, McCloskey TC, Fadayel GM, Taylor VL, Murawsky MK, Nyce P, Salituro FG. Pharmacological characterisation of MDL 105,519, an NMDA receptor glycine site antagonist. Eur J Pharmacol. 1997;323:181–192. - PubMed
    1. Benveniste M, Mayer ML. Kinetic analysis of antagonist action at N-methyl-d-aspartic acid receptors. Biophys J. 1991;59:560–573. - PMC - PubMed

MeSH terms