. 2000 Jun 1;20(11):4091-8.
doi: 10.1523/JNEUROSCI.20-11-04091.2000.

Functional coupling between neurons and glia

Affiliations

Functional coupling between neurons and glia

V Alvarez-Maubecin et al. J Neurosci. .

Abstract

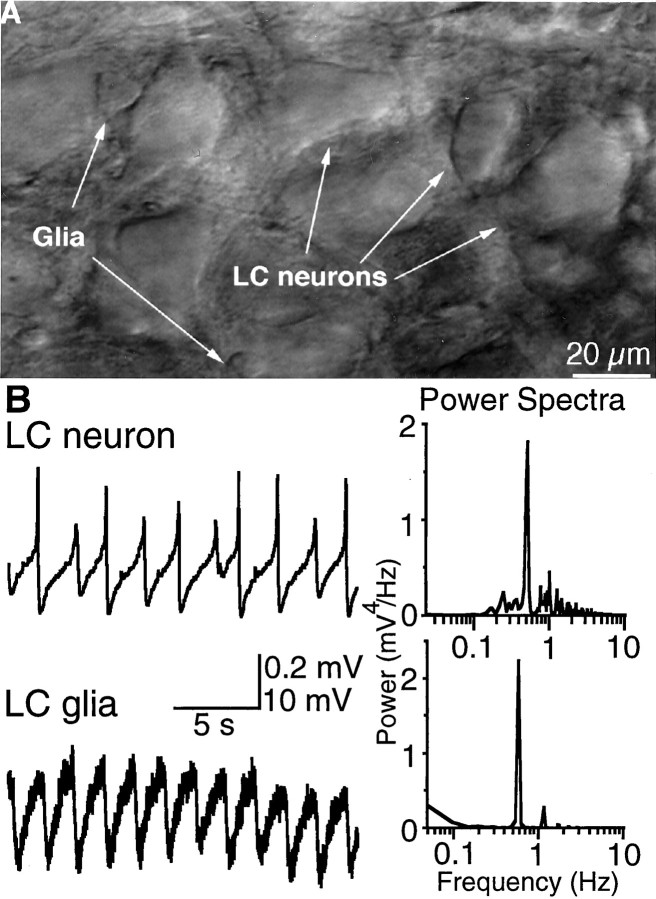
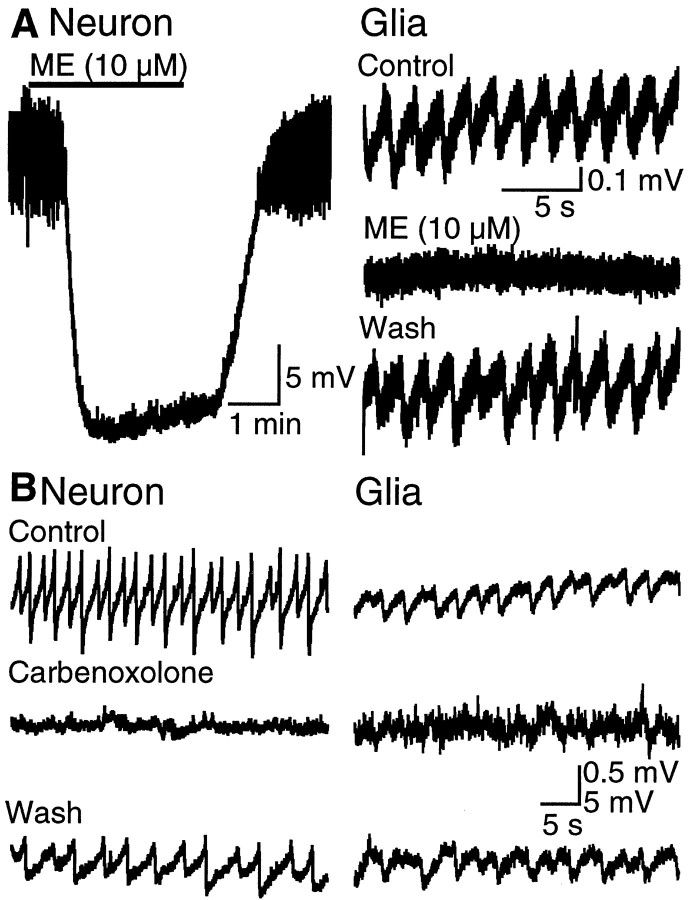
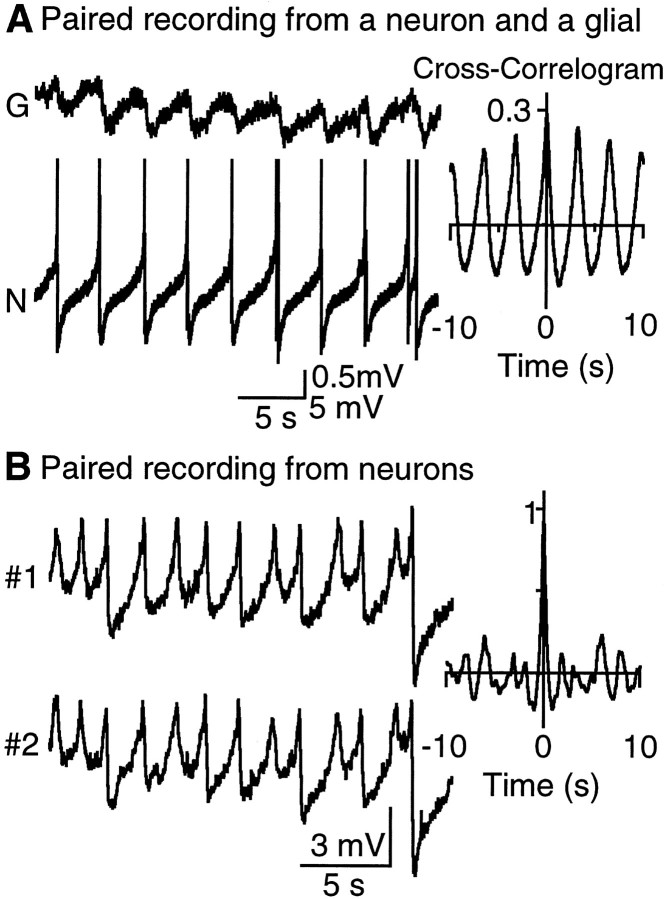
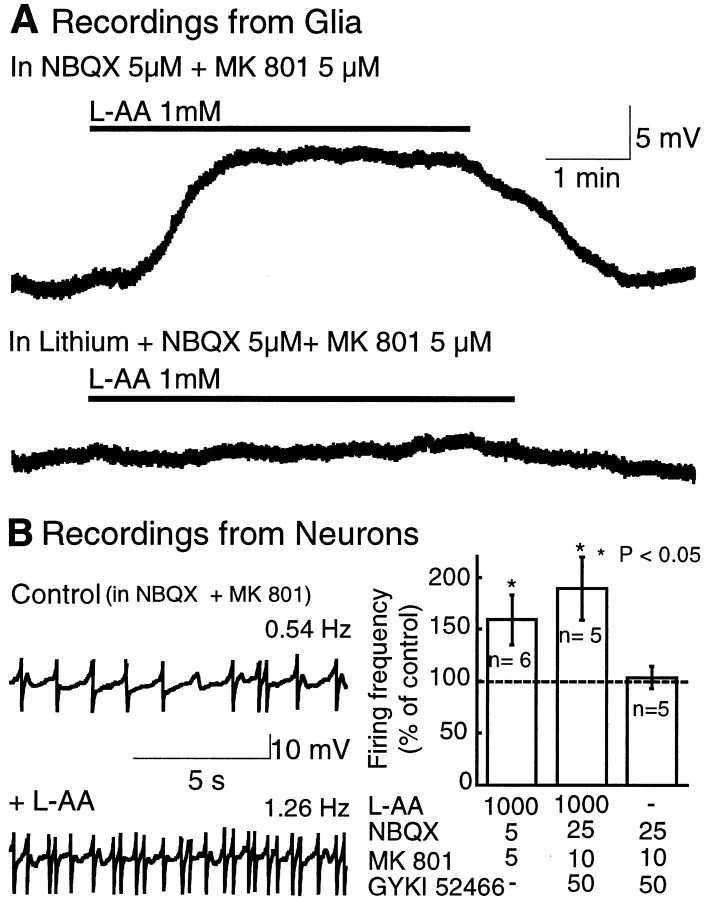
Neuronal-glial interactions play an important role in information processing in the CNS. Previous studies have indicated that electrotonic coupling between locus ceruleus (LC) neurons is involved in synchronizing the spontaneous activity. The results of the present study extend the functional electrotonic coupling to interactions between neurons and glia. Spontaneous oscillations in the membrane potential were observed in a subset of glia. These oscillations were synchronous with the firing of neurons, insensitive to transmitter receptor antagonists and disrupted by carbenoxolone, a gap junction blocker. Hyperpolarization of neurons with [Met] (5)enkephalin blocked the oscillations in glia. Selective depolarization of glia with a glutamate transporter substrate (l-alpha-aminoadipic acid) increased the neuronal firing rate, suggesting that changes in the membrane potential of glia can modulate neuronal excitability through heterocellular coupling. Dye-coupling experiments further confirmed that small molecules could be transferred through gap junctions between these distinct cell types. No dye transfer was observed between neurons and oligodendrocytes or between astrocytes and oligodendrocytes, suggesting that the junctional communication was specific for astrocytes and neurons. Finally, immunoelectron microscopy studies established that connexins, the proteins that form gap junctions, were present on portions of the plasmalemma, bridging the cytoplasm of neurons and glia in LC. This heterocellular coupling extends the mechanisms by which glia participate in the network properties of the LC in which the degree of coupling is thought to influence cognitive performance.


Figures

Fig. 1.
Fig. 1.
Rhythmic oscillations in membrane potential of neurons and glia in the LC. A, High-power view of the LC in a brainstem slice from 1-week-old rat using infrared illumination. The differences in size and morphology between LC neurons and glia allowed selective recordings from each cell type. Scale bar, 20 μm.B, Left, Representative recordings from a neuron and a glial cell made in the presence of tetrodotoxin (1 μm) and BaCl2 (500 μm).Right, Power spectrum analyses of the membrane potential. For the glia, the peak was 0.58 Hz; for the neuron, the peak was 0.51 Hz.
Fig. 2.
Fig. 2.
Oscillations in glia depend on synchronized neuronal activity. A, Left, ME, a μ-opioid receptor agonist, hyperpolarizes the membrane potential of LC neurons and reversibly inhibits the subthreshold oscillations (n = 10). Right, ME reversibly abolishes membrane potential oscillations in glia (n = 6). Note that ME did not induce a change in the resting membrane potential of glia. B, Carbenoxolone (100 μm) disrupted oscillations in both glial and neuronal membrane potential. The effect of carbenoxolone reversed within 30 min of washout. All recordings were made in the presence of tetrodotoxin (1 μm) and BaCl2 (500 μm).
Fig. 3.
Fig. 3.
Synchronized oscillations in neurons and glia.A, Left, A paired whole-cell recording shows that glial oscillations are synchronous with neuronal activity.Right, Cross-correlogram: peak of 0.29, phase shift of 10 msec. B, Left, A paired whole-cell recording from two LC neurons. Right, Cross-correlogram: peak of 0.94, phase shift of 10 msec.
Fig. 4.
Fig. 4.
Selective depolarization of glia increases neuronal firing. A, l-AA depolarized the membrane potential of glia through activation of glutamate transporters. Top trace, Recording from a glial cell in the presence of ionotropic glutamate receptor antagonists NBQX (5 μm) and MK-801 (5 μm). Bottom trace, In same cell, substitution of sodium for lithium in the extracellular solution completely blocks glial depolarization.B, The effect of l-AA on neuronal firing frequency. Right, Recordings from an LC neuron before (Control, top trace) and during (bottom trace) l-AA application in the presence of NBQX (5 μm) and MK-801 (5 μm).Left, Average change induced by l-AA on the firing frequency of LC neurons, expressed as percentage of the control firing rate. The mean firing frequency in control was 0.59 ± 0.21 Hz. Statistical differences were determined by the nonparametric Wilcoxon signed rank test. *p < 0.05 indicates significant difference.
Fig. 5.
Fig. 5.
Dye coupling from glia to neurons.A, B, Representative pictures of dye transfer from glia to neurons in brain slices in which a single glial cell was filled with neurobiotin. LC neurons (large arrows) appeared stained together with several dozen smaller cells with astrocytic morphology (small arrows).C, Dye transfer between astrocytes was observed in all the slices in which an astrocyte was filled (n = 13). D, Oligodendrocytes were stained in 10 of 23 slices (43%) in which a single glial cell was filled. In all these cases, only the filled cell was stained. Scale bar, 20 μm.
Fig. 6.
Fig. 6.
Cellular identity of dye-coupled cells in the LC.A, Triple staining with FITC-conjugated antibodies against the astrocytic marker S-100β (green), Rhodamine Red-X-conjugated antibodies against the neuronal marker tyrosine hydroxylase (blue), and Cy-5-conjugated streptavidin (red) to reveal neurobiotin localization.B, Higher magnification of the area surrounding the neurobiotin injection site. Multiple yellow cells indicate the colocalization of the astrocytic marker and neurobiotin. Two purple cells indicate colocalization of TH and neurobiotin. C shows the same field of view as inB with only the neurobiotin stain. Scale bar, 40 μm.
Fig. 7.
Fig. 7.
Electron micrographs showing the ultrastructural localization of Cx32 using peroxidase or gold-silver labeling in the LC. A, A pair of adjacent dendrites exhibiting gold-silver labeling for TH (arrowheads) also exhibits peroxidase labeling for Cx32 (straight open arrows) along portions of their apposed plasma membranes.B, Gold-silver labeling for Cx32 (straight open arrows) also reveals the presence of Cx32 on both sides of paired apposed peroxidase-labeled TH dendrites (TH-d) whose membranes (small filled arrows) tend to approach at the point at which the connexin proteins are localized.C, Gold-silver labeling for Cx32 (straight open arrow) can be detected along the plasma membrane of apposed peroxidase TH dendrites. One of the TH dendrites is also apposed to a third TH dendrite (small filled arrows), which lacks Cx immunolabeling. D, Two gold-silver (arrowheads) TH-positive dendrites are separated from one another by a glial process (asterisks) that exhibits peroxidase labeling for Cx32 (straight open ar-row). E, F, Serial sections in which gold-silver labeling for Cx32 (straight open arrows) was identified on the cytoplasmic surface of a peroxidase-labeled TH dendrite and in an apposed glial process (asterisks) that separates two TH-positive dendrites from one another. Scale bars: A, 0.86 μm;B, E, F, 0.2 μm;C, 0.37 μm; D, 0.62 μm.G, Pie charts illustrating the distribution of Cx32- and Cx26-immunoreactive profiles pooled from peroxidase and gold-silver stained tissue. For Cx32, 203 immunolabeled profiles were examined across three ultrathin sections from three animals. For Cx26, 89 profiles were analyzed across three ultrathin sections from two animals. The Cx immunoreactivity grouped in Otherscorresponds to Cx32 localized to apposed membranes of glia and axon terminals and Cx32 in association with myelinated axons. The 8% of immunoreactivity for Cx26 was identified between glia and axons terminals.
Fig. 8.
Fig. 8.
Distribution of astrocytic markers in the LC.A, Immunogold-silver labeling (black) for GFAP and peroxidase labeling for TH (brown) in the LC in a horizontal brain section. Note how GFAP-positive processes envelop TH-labeled cell bodies (black arrows). Scale bar, 160 μm. B, Immunofluorescent staining of S-100β (green, left) and TH (red, center) in the LC.Right, Superimposed image of both wavelengths showing the absence of colocalization and the enrichment of astrocytic processes surrounding LC neurons. Scale bar, 20 μm.

References

    1. Araque A, Sanzgiri RP, Parpura V, Haydon PG. Calcium elevation in astrocytes causes an NMDA receptor-dependent increase in the frequency of miniature synaptic currents in cultured hippocampal neurons. J Neurosci. 1998;18:6822–6829. - PMC - PubMed
    1. Bergles DE, Diamond JS, Jahr CE. Clearance of glutamate inside the synapse and beyond. Curr Opin Neurobiol. 1999;9:293–298. - PubMed
    1. Bezzi P, Carmignoto G, Pasti L, Vesce S, Rossi D, Rizzini BL, Pozzan T, Volterra A. Prostaglandins stimulate calcium-dependent glutamate release in astrocytes. Nature. 1998;391:281–285. - PubMed
    1. Chan J, Aoki C, Pickel VM. Optimization of differential immunogold-silver and peroxidase labeling with maintenance of ultrastructure in brain sections before plastic embedding. J Neurosci Methods. 1990;33:113–127. - PMC - PubMed
    1. Chang Q, Gonzalez M, Pinter MJ, Balice-Gordon RJ. Gap junctional coupling and patterns of connexin expression among neonatal rat lumbar spinal motor neurons. J Neurosci. 1999;19:10813–10828. - PMC - PubMed

Publication types

MeSH terms

LinkOut - more resources