. 2000 Jun 1;20(11):4267-85.
doi: 10.1523/JNEUROSCI.20-11-04267.2000.

Membrane mechanisms underlying contrast adaptation in cat area 17 in vivo

Affiliations

Membrane mechanisms underlying contrast adaptation in cat area 17 in vivo

M V Sanchez-Vives et al. J Neurosci. .

Abstract

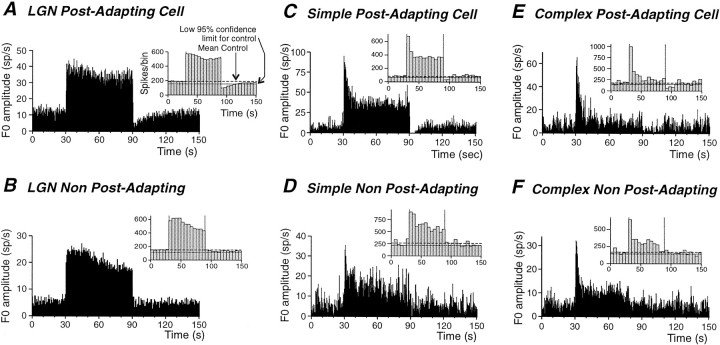
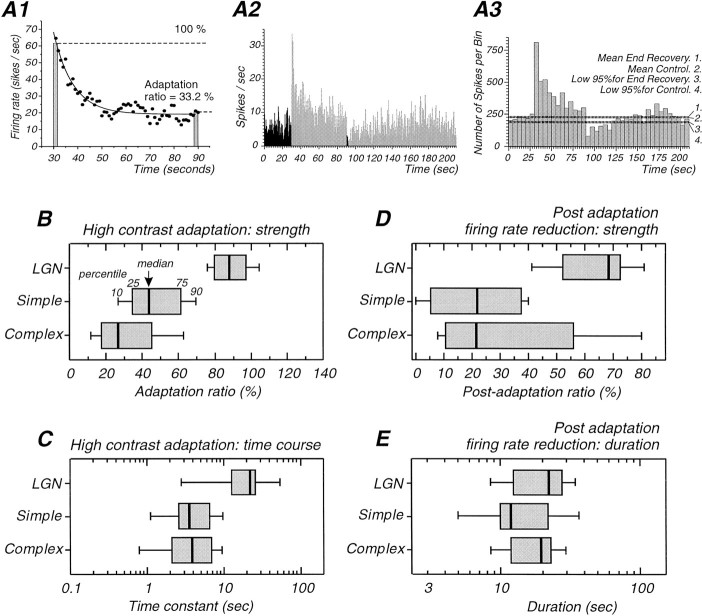
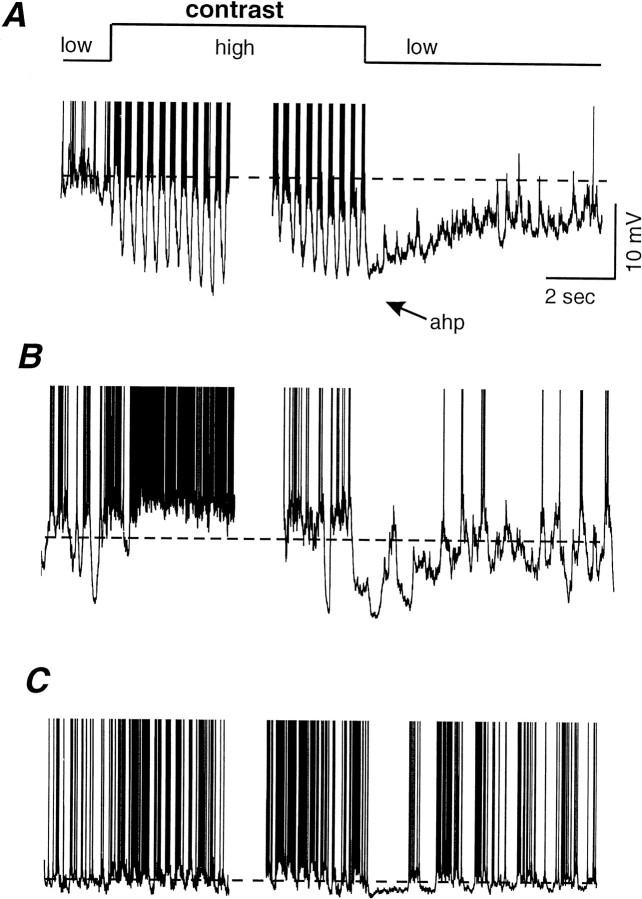
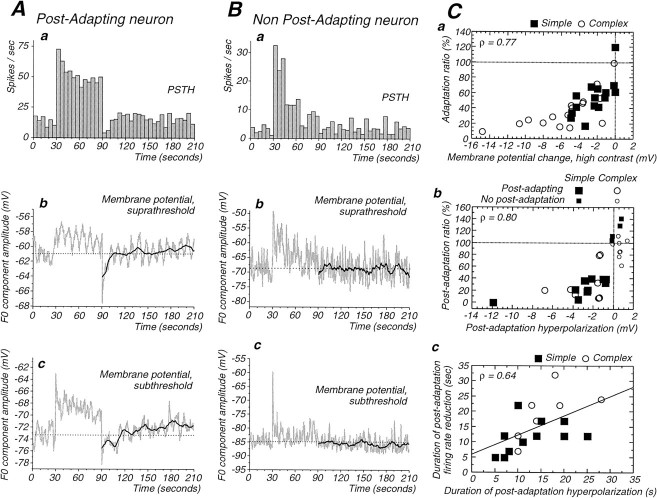
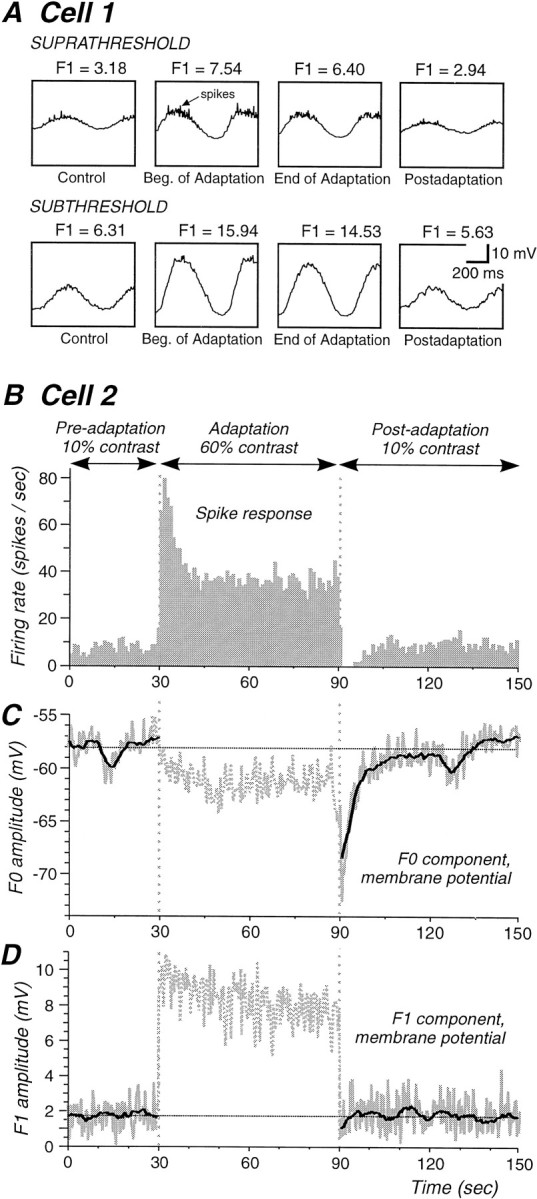
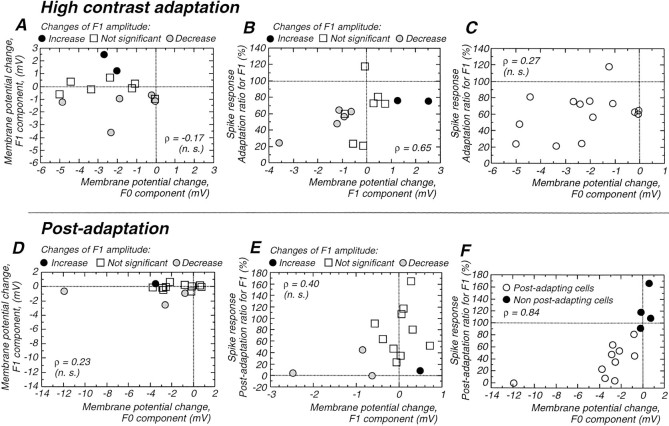
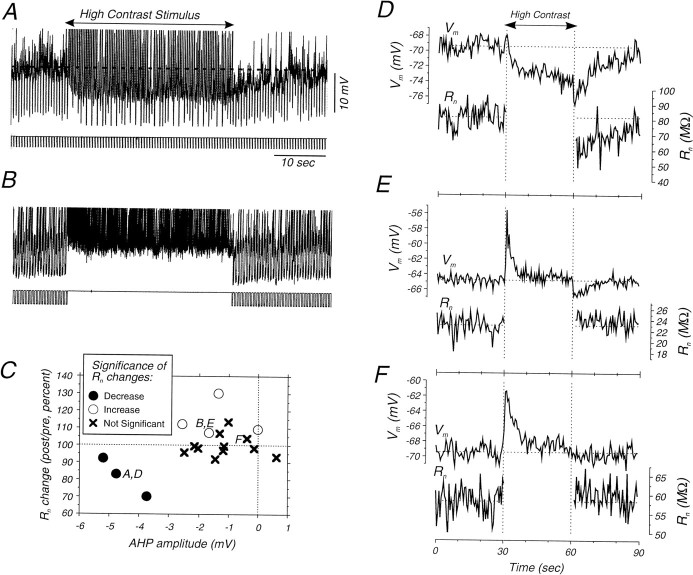
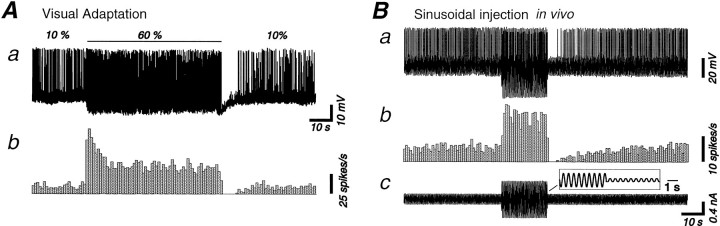
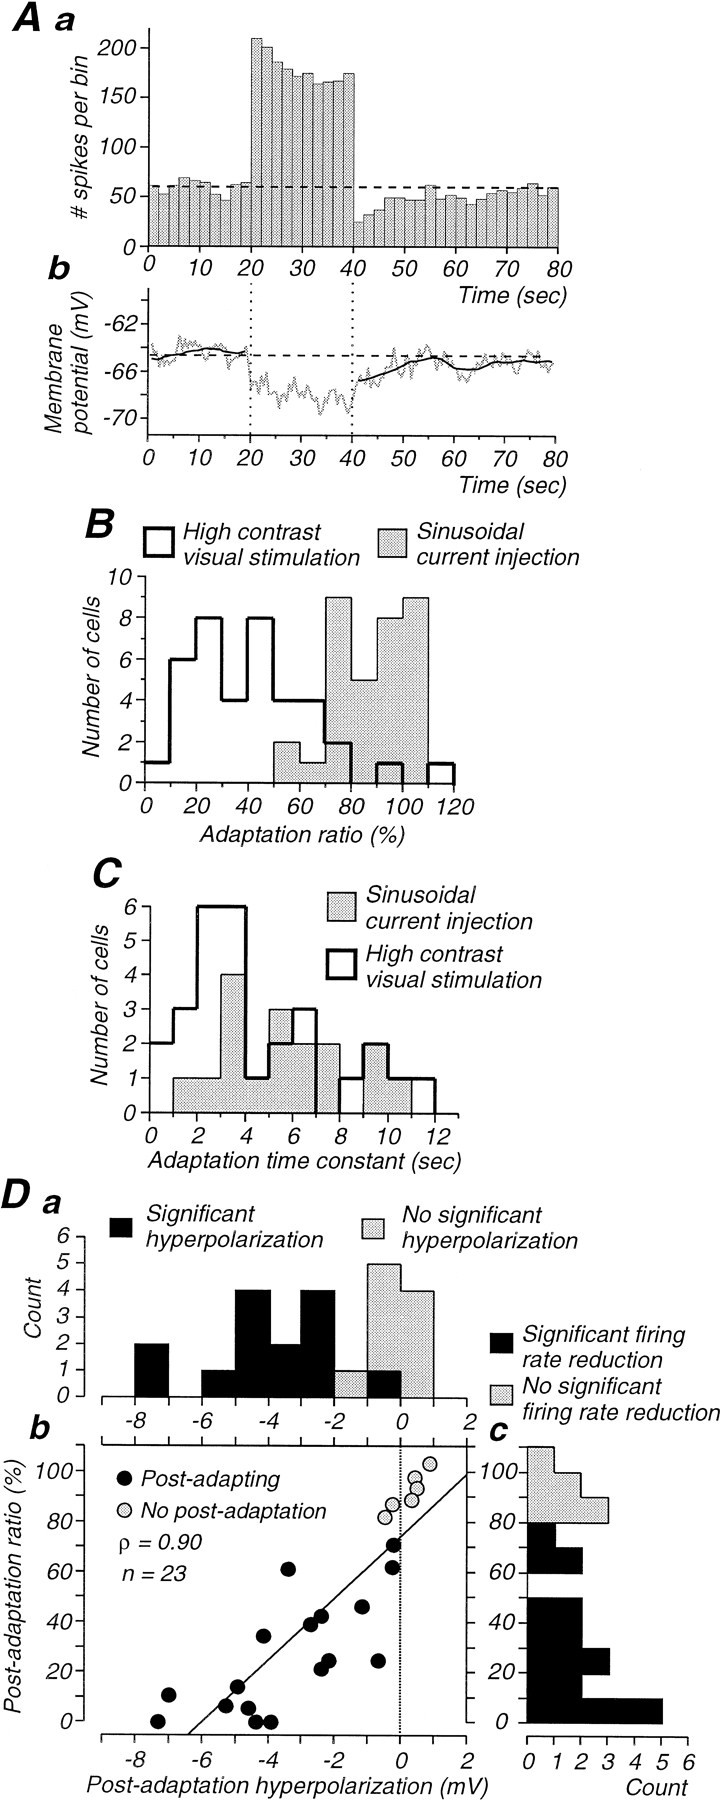
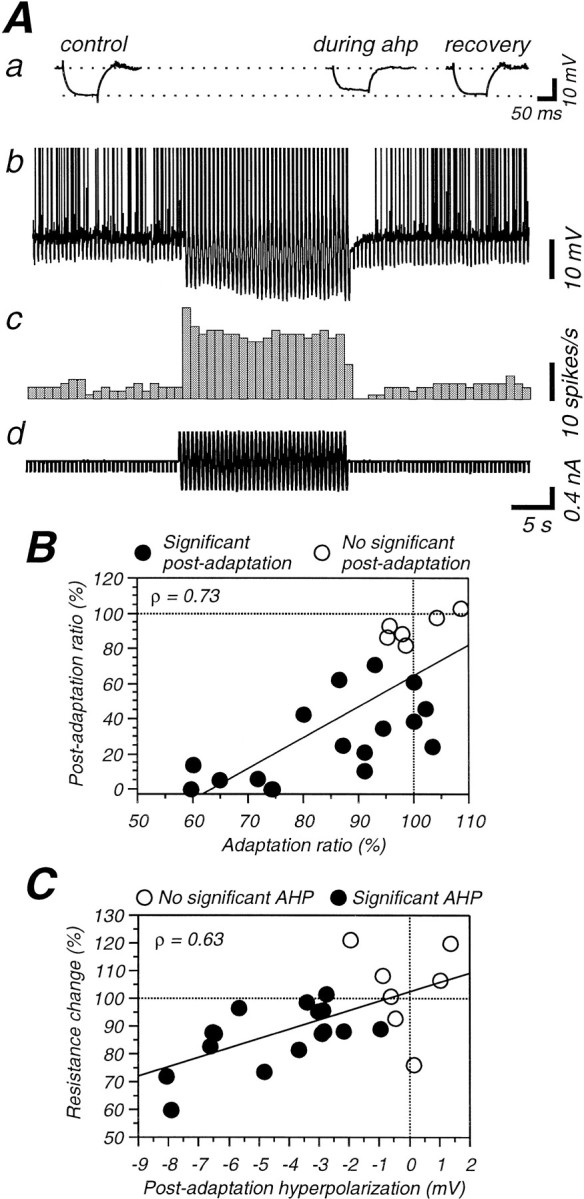
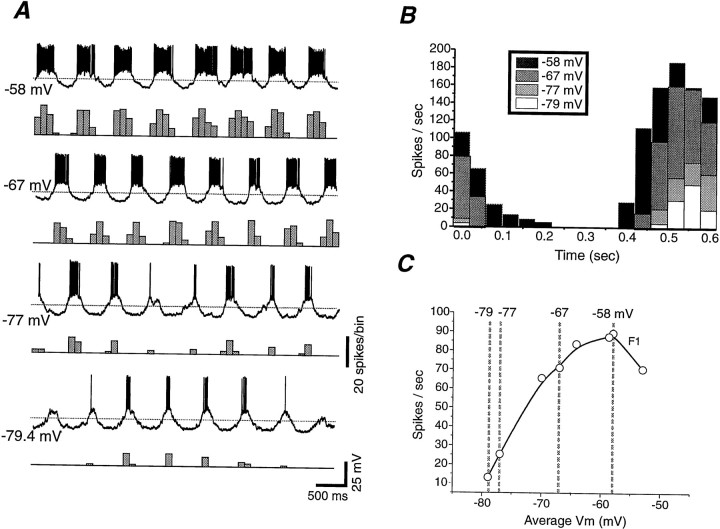
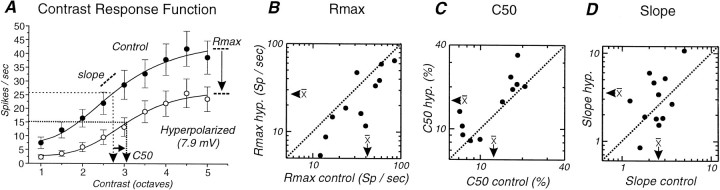
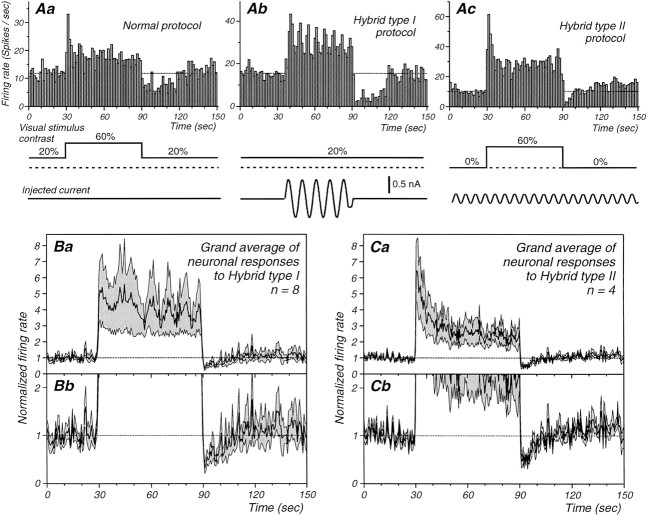
Contrast adaptation is a psychophysical phenomenon, the neuronal bases of which reside largely in the primary visual cortex. The cellular mechanisms of contrast adaptation were investigated in the cat primary visual cortex in vivo through intracellular recording and current injections. Visual cortex cells, and to a much less extent, dorsal lateral geniculate nucleus (dLGN) neurons, exhibited a reduction in firing rate during prolonged presentations of a high-contrast visual stimulus, a process we termed high-contrast adaptation. In a majority of cortical and dLGN cells, the period of adaptation to high contrast was followed by a prolonged (5-80 sec) period of reduced responsiveness to a low-contrast stimulus (postadaptation suppression), an effect that was associated, and positively correlated, with a hyperpolarization of the membrane potential and an increase in apparent membrane conductance. In simple cells, the period of postadaptation suppression was not consistently associated with a decrease in the grating modulated component of the evoked synaptic barrages (the F1 component). The generation of the hyperpolarization appears to be at least partially intrinsic to the recorded cells, because the induction of neuronal activity with the intracellular injection of current resulted in both a hyperpolarization of the membrane potential and a decrease in the spike response to either current injections or visual stimuli. Conversely, high-contrast visual stimulation could suppress the response to low-intensity sinusoidal current injection. We conclude that control of the membrane potential by intrinsic neuronal mechanisms contributes importantly to the adaptation of neuronal responsiveness to varying levels of contrast. This feedback mechanism, internal to cortical neurons, provides them with the ability to continually adjust their responsiveness as a function of their history of synaptic and action potential activity.


Figures

Fig. 1.
Fig. 1.
Contrast adaptation and adaptation aftereffects in dLGN and cortical cells. The adaptation protocol consisted of a preadaptation period of 30 sec of low-contrast sinusoidal stimuli followed by an adaptation period of 30–60 sec of a high-contrast stimulus. The postadaptation period consisted of 60–120 sec of a low-contrast stimulus. A, PSTH for an LGN cell exhibiting both a decrease in action potential discharge rate during the adaptation period (adaptation) followed by a decrease responsiveness during the postadaptation period (postadaptation suppression). The inset is a non-normalized PSTH (ordinate is number of spikes per bin) with a bin width of 5 sec. This type of PSTH was used to compute the mean number of spikes per bin during the preadaptation period and the associated lower 95% confidence limit. The lower 95% confidence limit was used to access significance of postadaptation reduction of firing rate as well as its duration. The cell in A shows a significant decrease of activity for 27.5 sec. B, Example of an LGN neuron in which the action potential discharge rate decreased during the presentation of the high-contrast stimulus, but which did not exhibit a significant postadaptation decrease in firing rate. C, D, Examples of responses for two simple cells. Although both cells showed an adaptation of firing during high contrast, only the cell in C showed a significant postadaptation reduction of activity (inset). The duration of the postadaptation reduction was 12.5 sec in this case. E,F, Examples of the visual responses for two complex cells. Both cells also display an adaptation of firing during the high contrast. Only the cell in E presents a significant postadaptation firing rate reduction (inset), which lasted 22.5 sec.
Fig. 2.
Fig. 2.
Characteristics of adaptation and postadaptation in cortical and dLGN neurons. A, Illustration of the methods used for quantification of the strength and time constant of adaptation (A1) and the strength (A2) and the duration (A3) of postadaptation suppression.A1, Plot of the adaptation of action potential discharge with a bin width of 1 sec. The adaptation is fitted with an exponential function. The average of the last five cycles of the drifting grating are divided by the average of the first five to give the adaptation ratio (33.2% in this case). A2, The strength of the postadaptation suppression was measured as the average of the spike response (F0) over the first five cycles of the postadaptation period (black bars) expressed as a percentage of the average response during the preadaptation period (black bars).A3, The duration of the postadaptation suppression was measured as the interval between the end of the high-contrast stimulus and the middle of the first of two adjacent bins that are the first to be higher than the 95% confidence interval. B–E, Box plot representations of characteristics of adaptation in LGN, simple, and complex cells. The box corresponds to the 25–75 percentiles (interquartile range), with the median indicated by thevertical line inside the box. The small bars outside the box correspond to the 10 and 90 percentiles. These plots reveal that adaptation is stronger in simple and complex cells in comparison with dLGN neurons (B), that the time course of adaptation is slower in dLGN cells (C), that the amplitude of postadaptation suppression in cortical cells is significantly greater than in dLGN cells (D), and that the duration of postadaptation suppression is similar in all cell types (E).
Fig. 3.
Fig. 3.
Examples of membrane potential response (raw traces) to the adaptation protocol. A, Intracellular recording from a cortical simple cell during the presentation of a low (10%)-, high (60%)-, low (10%)-contrast grating sequence. A substantial portion of the response to the high-contrast stimulus has been removed for illustrative purposes. Note the large (average of −11.9 mV) hyperpolarization of the membrane potential during the presentation of the high-contrast stimulus and the persistence of this hyperpolarization as an afterhyperpolarization after the transition back to the low-contrast stimulus. B, Contrast adaptation in a complex cell exhibiting a moderate (average of −6.8 mV) hyperpolarization after the presentation of a high-contrast stimulus. C, Example of contrast adaptation in a cortical simple cell exhibiting only a small (average of −2.8 mV) hyperpolarization after exposure to a high-contrast stimulus.
Fig. 4.
Fig. 4.
Properties of the average membrane potential responses during the adaptation and postadaptation periods.Aa, PSTH illustrates the adaptation and postadaptation reduction in a simple cell. Ab, Average membrane potential (F0) for the same cell as in Aa. The slow oscillation corresponds to a respiratory artifact. The dark line in postadaptation period corresponds to a smoothed version of the average (29 points). The dashed line corresponds to the mean F0 for the preadaptation period. The high-contrast period is associated with membrane depolarization, and the period of postadaptation suppression is associated with a prolonged hyperpolarization, the duration of which is similar to that of the postadaptation reduction of firing rate in Aa (14 and 12 sec, respectively). Ac, Averaged membrane potential for an adaptation protocol during which intracellular injection of DC was used to prevent action potential discharge. Same cell as inAa and Ab. During the high-contrast stimulation, the membrane first depolarizes, but the depolarization decays (adapts) over time. After the high-contrast stimulation, a hyperpolarization is still observed, indicating that its generation did not require action potential discharge. Ba, PSTH of a complex cell that exhibited adaptation during the presentation of the high-contrast stimulus but did not present a significant reduction of firing during the postadaptation period. Bb, The time course of F0 for the membrane potential for the same cell shows a depolarization that decays over time during the high-contrast presentation. However, no significant hyperpolarization could be detected after the high-contrast stimulus. Bc, Averaged F0 as a function of time for membrane potential after the intracellular injection of DC to suppress generation of action potentials (same cell as Bb). Again, the membrane response during the high-contrast stimulus decays as a function of time, but there was no significant postadaptation hyperpolarization. C,Relationship between membrane potential and firing rate changes during and after adaptation. There is a significant correlation between the adaptation ratio and the change in membrane potential during high-contrast adaptation (Ca) as well as a significant correlation between the amplitude of the postadaptation hyperpolarization and the degree of suppression of the postadaptation visual response (Cb). Finally, the duration of the postadaptation hyperpolarization is also correlated with the duration of the postadaptation suppression of spike response (Cc). Note in Ca that the stronger firing rate adaptation of complex cells is associated with a larger decrease in the high-contrast evoked depolarizing response.
Fig. 5.
Fig. 5.
Changes in the visually evoked modulated response (F1 component) amplitude for simple cells with contrast adaptation.A, Average membrane potential responses to the sinewave grating in a simple cell during the suprathreshold and subthreshold stimulus protocol (amplitude of the F1 component is givenabove each trace). The F1 component shows a small decrease both during the adaptation and during the initial part of the postadaptation period. Note that the window shows 1.5 cycles.B, PSTH of the spike response of a simple cell (different from that in A) that displays a complete suppression of action potential discharge after adaptation.C, The average membrane potential (F0) exhibits a decrease during the presentation of the high-contrast stimulus (see Fig. 3A). During the postadaptation period, the membrane potential is substantially hyperpolarized and slowly recovers to normal. D, The visually modulated component (F1) gradually decreases during the high-contrast stimulus. Immediately after adaptation, a small (0.6 mV) change in the F1 amplitude is observed. Although this change is statistically significant, it is much smaller than the amplitude of the hyperpolarization (11.9 mV) (C).
Fig. 6.
Fig. 6.
Relationship between F1 component changes and other parameters. The top of the figure represents changes that took place during the period of high-contrast adaptation, whereas the bottom illustrates measurements during the postadaptation period. A, During high-contrast adaptation, there is no correlation between the changes in the F1 and F0 components of the membrane potential. B, The decrease in the modulated spike response (F1, spikes) and the modulated membrane potential response (F1, membrane potential) are significantly correlated (ρ = 0.65). C, Changes of the F1 component of the firing are not correlated with changes in membrane potential during high-contrast stimulation. Note however that negative values of membrane potential changes are associated with decrease of firing rate, which was not the case with the F1 component of the membrane potential in B. D, The modulated component of the visual response (F1) is slightly decreased during the postadaptation period in only three cells (gray dots), whereas the membrane potential (F0) can be strongly hyperpolarized. Furthermore, these two parameters were not correlated.E, There is no significant correlation between the changes in the modulated component of the spike response (F1, spike) and the changes for the modulated response of the membrane potential (F1, membrane). F, There is a strong correlation between the decrease in the modulated spike response (F1) and the amplitude of the hyperpolarization (F0) during the postadaptation suppression. Altogether, these results demonstrate that the postadaptation reduction of firing rate is correlated with a tonic hyperpolarization of the membrane potential with only minor changes of the modulated component of the visually evoked synaptic drive.
Fig. 7.
Fig. 7.
Changes in membrane resistance during the postadaptation hyperpolarization and firing rate reduction.A, Raw traces illustrating the membrane potential and response to intracellular injection of current pulses in a cell that exhibited a significant decrease in apparent input resistance during the hyperpolarization. B, Raw traces illustrating the membrane potential and current pulse responses in a cell that exhibited a small increase in input resistance during the postadaptation period.C, Plot of the amplitude of AHP versus the relative apparent input resistance during the postadaptation period.D, Plot of the membrane potential and apparent input resistance averaged across repeats of the adaptation protocol for a cell exhibiting a significant decrease in Rnduring the postadaptation period (same cells as A).E, Plot of Vm andRn for a cell that exhibits a small AHP and a small increase in Rn (same cell asB). F, Plot ofVm and Rn for a cell that neither shows a significant AHP nor significant change inRn.
Fig. 8.
Fig. 8.
Neuronal responses induced with the contrast adaptation protocol can be mimicked by the intracellular injection of current. Each example is a raw trace corresponding to a single run of contrast adaptation in A and to sinusoidal current injection in B. The two traces are from different cells.A, Presentation of a high-contrast sinusoidal grating for 1 min is followed by a large-amplitude hyperpolarization (membrane potential in Aa) that leads to a postadaptation suppression of firing evidenced by the rate histogram inAb. Same cell as in Figure 5B–D.B, A sinewave (2 Hz) current of low (0.35 nA peak-to-peak), then high (1 nA), then low intensity anew was injected intracellularly to mimic the discharge pattern of simple cells during contrast adaptation protocol. The current is shown inBc, with an expanded view for a portion of it in theinset. During the injection of the higher intensity current, the action potential discharge of the neuron adapts (rate histogram, Bb), although this was typically less than during contrast adaptation to a visual stimulus (compare withAb). The action potential discharge is reduced below preadaptation level after return to the low-intensity current. Although this is obscured by the sinusoidal modulation of the membrane potential, this reduction was associated with a F0 hyperpolarization of 1.3 mV (Ba, raw trace).
Fig. 9.
Fig. 9.
Properties of adaptation induced with sinusoidal current injection and comparison to those induced by visual stimuli.A, Peristimulus histogram illustrating the adaptation of the neurons response to the intracellular injection of a sinusoidal current of low (0.5 nA), high (1.4 nA), and low amplitude. The average membrane potential decreases during adaptation and exhibits a significant postadaptation hyperpolarization. The dark line represents a smoothed (15 point) version of the average membrane potential. B, Distribution of adaptation ratios, as calculated in Figure 2A1, for cells adapted to either a high-contrast visual stimulus (open histogram) or sinusoidal current injection (gray histogram). Note that the adaptation to the visual stimulus is significantly stronger. C, The time constant of adaptation is similar for both visual stimuli and current injection. D, The suppression of action potential firing during the postadaptation period is significantly correlated with the amplitude of the hyperpolarization in cells intracellularly injected with sinusoidal currents (Db). Da, Distribution of postadaptation hyperpolarizations amplitude. Dc, Distribution of postadaptation ratios for firing rate.
Fig. 10.
Fig. 10.
A, Postadaptation suppression induced by sinusoidal current injection is associated with a decrease in membrane resistance. A, Raw intracellular recording illustrating the effect of the intracellular injection of a sinusoidal current on the average membrane potential, spike response, and apparent input resistance of the cell. Aa, Averaged responses to hyperpolarizing current pulses before, during the AHP and after recovery illustrating the change in apparent input resistance during the AHP. Ac, Rate histogram illustrating the change in spike response. Ad, Current used to induce adaptation and resistance measurement. B, With the intracellular injection of sinusoidal current, there is a significant correlation between the degree of adaptation during the high-intensity stimulus (Adaptation ratio) and the degree of postadaptation suppression (Postadaptation ratio). C,There is a significant correlation between the amplitude of the postadaptation hyperpolarization and the change in membrane resistance with adaptation induced with the intracellular injection of sinusoidal currents. Note that, on average, a hyperpolarization >3 mV is required to produce a resistance decrease to <90% of the control value.
Fig. 11.
Fig. 11.
Effect of changes in membrane potential on the amplitude of visual responses to sinewave gratings. A,Individual traces illustrating the responses of a simple cell to the presentation of a steady 80% contrast sinewave grating while the cell was positioned at different membrane potentials with the intracellular injection of DC. The number next to each intracellular recording is the average membrane potential of the PSP response and is indicated by thedashed line. B, Peristimulus histograms illustrating the change in neuronal spike response with hyperpolarization or depolarization to different membrane potentials.C, Plot of the firing rate (F1 component) against average membrane potential. Note that hyperpolarization of the membrane potential by 5–10 mV can have a large effect on the response of the neuron to a high-contrast stimulus.
Fig. 12.
Fig. 12.
Effect of changes in membrane potential on contrast–response function. A, Average contrast–response function of action potential discharges in cortical neurons (n = 12) at two different membrane potentials. Hyperpolarization of the membrane potential by an average of 7.9 mV (n = 12) results in a decrease in the response of the neuron at each level of contrast. Fitting the two sets of data points with a modified Hill equation revealed that the hyperpolarization resulted in a decrease in the measure of maximal response (Rmax), a decrease in slope (s) of the contrast response function, and an increase in the contrast that gives 50% of the maximal spike response (C50). Two sequences of increasing contrast were used: from 2.5 to 40% and from 5 to 80%. We combined the data of these two different cell groups and plotted contrast in octaves. B, Plot of Rmax in control versus after hyperpolarization for all cells tested. Note the shift in the Rmax to the bottom right, indicating consistent shift to lower levels with hyperpolarization. C, Plot ofC50 in control versus with hyperpolarization. With hyperpolarization this is shifted to thetop left, indicating a consistent increase in the contrast value that gave a half-maximal response. D,Plot of the slope of the contrast–response function before and after hyperpolarization reveals a slight but nonsignificant change in the slope of the contrast–response function with hyperpolarization.
Fig. 13.
Fig. 13.
The intracellular injection of current can substitute for the presentation of a visual stimulus in adaptation protocols. A, Peristimulus histograms illustrating single-cell responses to either the presentation of a low-contrast visual stimulus and adaptation to a high-contrast one (Aa,Normal protocol), the replacement of the high-contrast stimulus with the intracellular injection of a 1.4 Hz sinusoidal current (Ab,Hybrid type I), and the replacement of the low-contrast visual stimulus with a low-amplitude 1.4 Hz sinusoidal current injection (Ac, Hybrid type II). Note that the injection of a high-amplitude sinusoidal current results in a marked decrease in the neuronal response to the visual stimulus and that the converse is also true: the presentation of a high-contrast visual stimulus results in a significant decrease in the response to a low-intensity sinusoidal current injection. The time course of the sinusoidal current is not drawn to scale. B, Average of all cells showing significant postadaptation suppression with the performance of the hybrid type I protocol (n = 8 of 9). The average (thick line) and the average ±1 SEM (thin lines) are shown in Ba and Bb. The vertical axis is expanded in Bb to highlight the postadaptation suppression of the visual response. C,Average of all cells showing a significant postadaptation suppression with hybrid type II protocol (n = 4 of 6). Again, the thick line represents the mean, and the thin line the mean ±1 SEM (Ca), and they-axis is pulled for better illustration of the postadaptation suppression of the current injection response inCb.

References

    1. Abeles M. Quantification, smoothing, and confidence limits for single-units' histograms. J Neurosci Methods. 1982;5:317–325. - PubMed
    1. Adorján P, Piepenbrock C, Obermayer K. Contrast adaptation and infomax in visual cortical neurons. Rev Neurosci. 1999;10:181–200. - PubMed
    1. Ahmed B, Anderson JC, Douglas RJ, Martin KAC, Nelson JC. Polyneuronal innervation of spiny stellate neurons in cat visual cortex. J Comp Neurol. 1994;341:39–49. - PubMed
    1. Ahmed B, Allison JD, Douglas RJ, Martin KAC. An intracellular study of the contrast-dependence of neuronal activity in cat visual cortex. Cereb Cortex. 1997;7:559–570. - PubMed
    1. Albrecht DG, Farrar SB, Hamilton DB. Spatial contrast adaptation characteristics of neurones recorded in cat's visual cortex. J Physiol (Lond) 1984;347:713–739. - PMC - PubMed

Publication types

Substances

LinkOut - more resources