. 2000 Jun 1;20(11):4311-9.
doi: 10.1523/JNEUROSCI.20-11-04311.2000.

Control of response selection by reinforcer value requires interaction of amygdala and orbital prefrontal cortex

Affiliations

Control of response selection by reinforcer value requires interaction of amygdala and orbital prefrontal cortex

M G Baxter et al. J Neurosci. .

Abstract

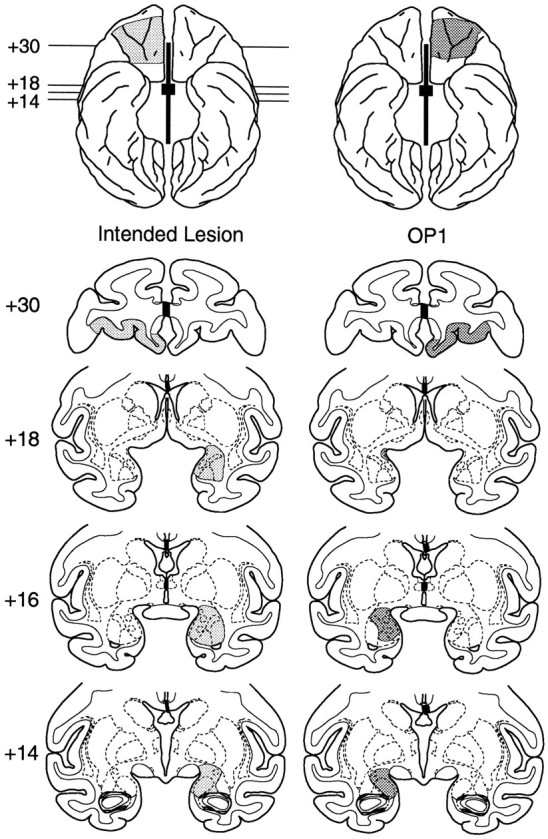
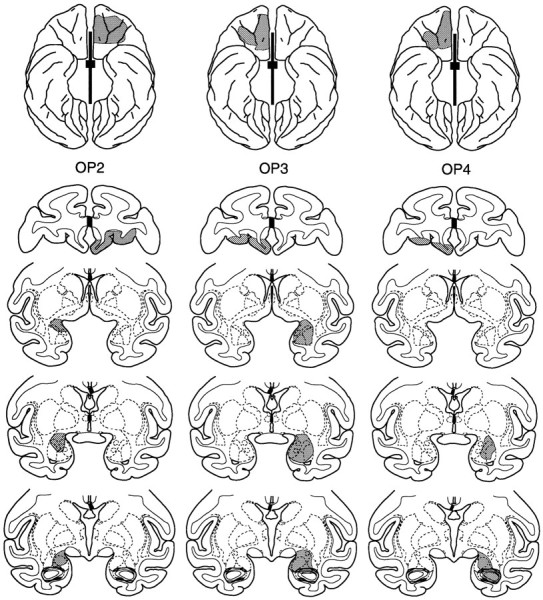
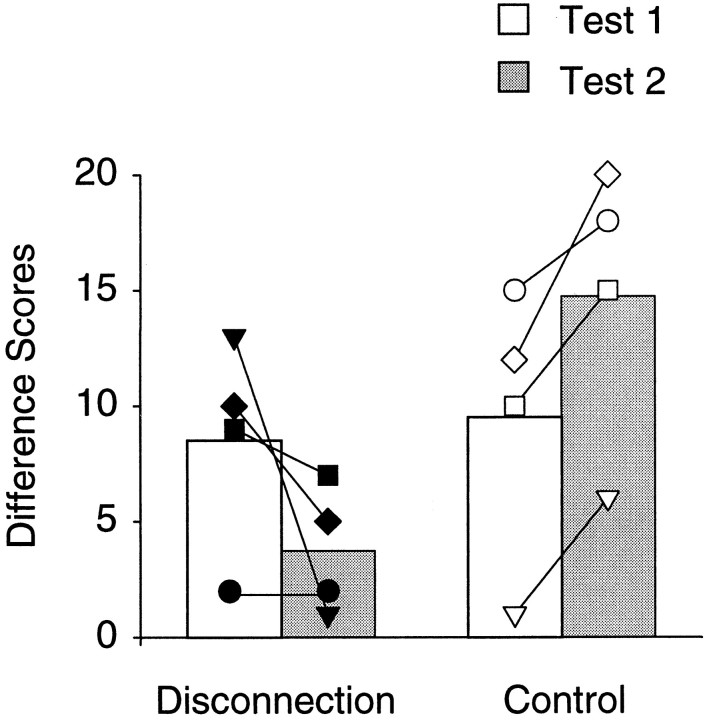
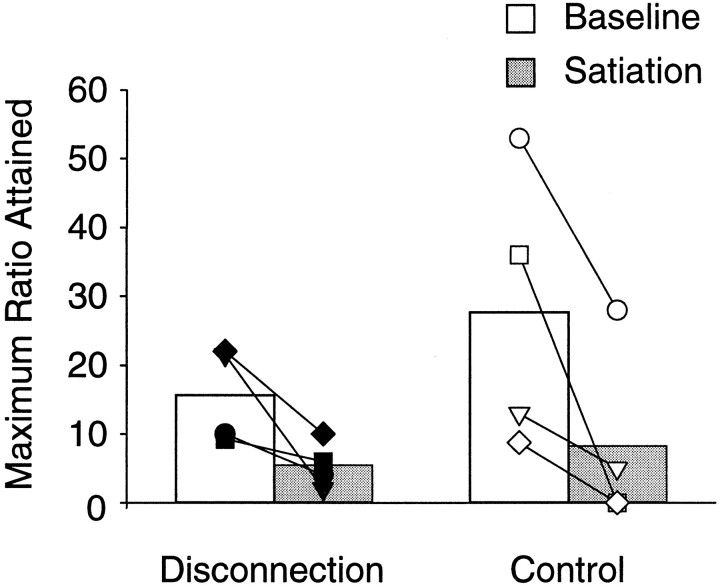
Goal-directed actions are guided by expected outcomes of those actions. Humans with bilateral damage to ventromedial prefrontal cortex, or the amygdala, are deficient in their ability to use information about positive and negative outcomes to guide their choice behavior. Similarly, rats and monkeys with orbital prefrontal or amygdala damage have been found to be impaired in their responses to changing values of outcomes. In the present study, we tested whether direct, functional interaction between the amygdala and the orbital prefrontal cortex is necessary for guiding behavior based on expected outcomes. Unlike control monkeys, rhesus monkeys with surgical disconnection of these two structures, achieved by crossed unilateral lesions of the amygdala in one hemisphere and orbital prefrontal cortex in the other, combined with forebrain commissurotomy, were unable to adjust their choice behavior after a change in the outcome (here, a reduction in the value of a particular reinforcer). The lesions did not affect motivation to work for a food reinforcer, or food preferences, per se. Hence, the amygdala and orbital prefrontal cortex act as part of an integrated neural system guiding decision-making and adaptive response selection.


Figures

Fig. 1.
Fig. 1.
Schematic of testing sequence for the reinforcer devaluation study. Control subjects received no surgery and were given a period of rest equivalent to that provided for the operated monkeys. Note that surgery 2 completes the disconnection of amygdala and orbital prefrontal cortex in all operated subjects.
Fig. 2.
Fig. 2.
Intended lesion and plots of the orbital prefrontal cortex and amygdala lesions in the four operated cases (Op1–Op4), shown on ventral surface views (top) and coronal sections (bottom) from a standard rhesus monkey brain. The intended lesion is shown in the leftmost column. The thick black line and small rectangle between the hemispheres in this and other ventral views indicates the extent of the section of the corpus callosum and anterior commissure, respectively; positions of the stereotaxic levels illustrated in the coronal sections are also indicated. The ventral views for Op1–Op4 show reconstructions of the extent of the orbital prefrontal cortex lesions, and are reversed to aid in matching to the individual sections (i.e., the left hemisphere is on theleft). The numbers to theleft of the coronal sections indicate the distance in millimeters from the interaural plane. Compare and contrast with Figure3.
Fig. 2.
Fig. 2.
Intended lesion and plots of the orbital prefrontal cortex and amygdala lesions in the four operated cases (Op1–Op4), shown on ventral surface views (top) and coronal sections (bottom) from a standard rhesus monkey brain. The intended lesion is shown in the leftmost column. The thick black line and small rectangle between the hemispheres in this and other ventral views indicates the extent of the section of the corpus callosum and anterior commissure, respectively; positions of the stereotaxic levels illustrated in the coronal sections are also indicated. The ventral views for Op1–Op4 show reconstructions of the extent of the orbital prefrontal cortex lesions, and are reversed to aid in matching to the individual sections (i.e., the left hemisphere is on theleft). The numbers to theleft of the coronal sections indicate the distance in millimeters from the interaural plane. Compare and contrast with Figure3.
Fig. 3.
Fig. 3.
Photomicrographs of Nissl-stained coronal sections from case Op3. A, Coronal section ∼30 mm rostral to the interaural plane. The extent of the orbital prefrontal cortex lesion in the left hemisphere is marked by the black arrows. The section of the corpus callosum is also apparent at this level and is marked by the white arrowhead.B, Coronal section 16 mm rostral to the interaural plane. Note the marked loss in volume of the amygdala in the right compared with the left hemisphere. The section of the corpus callosum is marked by the white arrowhead. Therectangles over the left and right temporal lobes show the approximate locations of the regions shown at higher power inC and D, respectively. C, Photomicrograph of the intact (left) amygdala. D, Photomicrograph of the right amygdala ∼9 months after injection of ibotenic acid, at the same magnification used in C. The marked neuronal cell loss and gliosis are characteristic of excitotoxic lesions.
Fig. 4.
Fig. 4.
The effects of reinforcer devaluation performed before (Test 1) and after (Test 2) the surgical disconnection had been completed. Difference scores (devaluation − baseline) for the control and disconnection group means are shown as bars, with the symbols representing scores of individual monkeys. Normal monkeys showed an enhancement of the devaluation effect in the second test, whereas operated monkeys showed a significant reduction of this effect in the second test. Op1,Filled diamonds; Op2, filled squares; Op3, filled inverted triangles; Op4, filled circles; Con1, open diamonds; Con2, open squares; Con3, open inverted triangles; Con4,open circle.
Fig. 5.
Fig. 5.
Results of the devaluation procedure (selective satiation) on progressive ratio testing. Baseline data shown are the mean, for each subject, of the maximum number of responses emitted (i.e., maximum ratio attained) during all four baseline sessions. Satiation data are scores for the single satiation session. Group means are shown as bars, with the symbols representing scores of individual monkeys. All monkeys, regardless of group membership, decreased responding during the test session in which the reinforcer was devalued by selective satiation. Symbols as in Figure 4.

References

    1. Adolphs R, Tranel D, Damasio AR. The human amygdala in social judgment. Nature. 1998;393:470–474. - PubMed
    1. Aggleton JP, Passingham RE. Syndrome produced by lesions of the amygdala in monkeys (Macaca mulatta). J Comp Physiol Psychol. 1981;95:961–977. - PubMed
    1. Aggleton JP, Passingham RE. An assessment of the reinforcing properties of foods after amygdaloid lesions in rhesus monkeys. J Comp Physiol Psychol. 1982;96:71–77. - PubMed
    1. Amaral DG, Price JL. Amygdalo-cortical projections in the monkey (Macaca fascicularis). J Comp Neurol. 1984;230:465–496. - PubMed
    1. Amaral DG, Price JL, Pitkänen A, Carmichael ST. Anatomical organization of the primate amygdaloid complex. In: Aggleton JP, editor. The amygdala: neuropsychological aspects of emotion, memory, and mental dysfunction. Wiley-Liss; New York: 1992. pp. 1–66.

Publication types

LinkOut - more resources