. 2000 Jun 6;97(12):6515-20.
doi: 10.1073/pnas.110533697.

Modeling RNA folding paths with pseudoknots: application to hepatitis delta virus ribozyme

Affiliations

Modeling RNA folding paths with pseudoknots: application to hepatitis delta virus ribozyme

H Isambert et al. Proc Natl Acad Sci U S A. .

Abstract

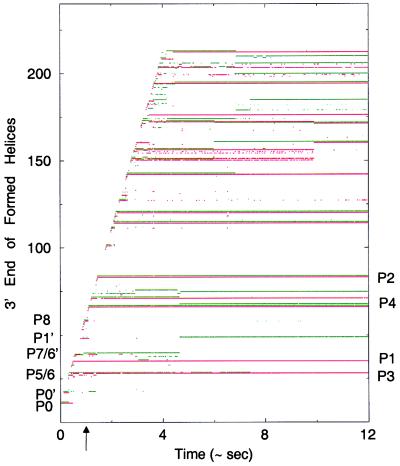
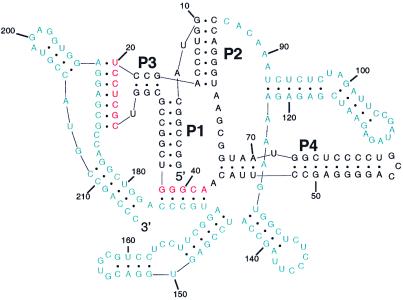
A quantitative understanding of nucleic acid hybridization is essential to many aspects of biotechnology, such as DNA microarrays, as well as to the structure and folding kinetics of RNA. However, predictions of nucleic acid secondary structures have long been impeded by the presence of helices interior to loops, so-called pseudoknots, which impose complex three-dimensional conformational constraints. In this paper we compute the pseudoknot free energies analytically in terms of known standard parameters, and we show how the results can be included in a kinetic Monte Carlo code to follow the succession of secondary structures during quenched or sequential folding. For the hepatitis delta virus ribozyme, we predict several nonnative stems on the folding path, characterize a kinetically trapped state, interpret several experimentally characterized mutations in terms of the folding path, and suggest how hybridization with other parts of the genome inactivates the newly formed ribozyme.


Figures

Figure 1
Figure 1
Short-scale description: The 8 allowed “nets.” We define “closed-nets” on a configuration by labeling all single-stranded closed circuits that can be drawn on the structure by hopping between adjacent single-stranded sections each time a stem end is encountered (see “closed-net-1”). (The dashed stems connect to other nets, but do not affect the order of the nets drawn. Other net-connecting stems may also be present along any single strand.) This procedure readily identifies hairpin, bulge, internal, and multibranched loops as other instances of closed-nets-0. However, the same procedure delimits also more complex single-stranded circuits (closed-nets-n) which pass through both ends of a number n of stems (i.e., n internal stems in a closed-net-n). Those nets correspond to locally pseudoknotted substructures. Similarly, for noncircular RNA sequences, we also partition the 5′ to 3′ open path into adjacent “open-nets-n” which are the continuous sections of the path that contain a minimal number n of internal stems. Note that open- and closed-nets-n can be simply related by the addition/deletion of one single-stranded section. Although this classification is quite general, we have limited our numerical studies to all structural topologies that can be decomposed into nets enclosing up to 2 internal helices, which includes most known RNA structures.
Figure 2
Figure 2
Large-scale description: “Crosslinked gel.” At large scales, we model RNA secondary structures by replacing each constitutive net with a single vertex. These vertices are connected by single-stranded and double-stranded regions. The large-scale conformational entropy is evaluated assuming that the vertices are connected by Gaussian “springs” whose mean squared elongation in isolation equals the relaxed mean squared distance between the connected nets in question. The conformational entropy of such a “Gaussian crosslinked gel” is then calculated numerically by n − 1 algebraic integrations, where n is the number of vertices and hence nets on the secondary structure. (In some cases, two vertices are connected by several stems, in which case we treat them as springs in parallel and lump accordingly.) To better agree with known structures as described in the text, we crudely incorporate excluded volume effects at this large scale by redefining the equilibrium elongation of the “springs” with an excluded volume exponent of 0.65 (vs. 0.5 for the ideal chain).
Figure 3
Figure 3
(a) Nucleation core exposed by shrinking up to four overlapping stems. The two horizontal dashed lines highlight the complementary strands of the stem whose formation rates are being evaluated. (b) Each position of the nucleation core may lead to several transition rates corresponding to different topologies.
Figure 4
Figure 4
(a) The secondary structure of the HDV genomic ribozyme (7). (b) The labeling of stems (l1, l2) and single-stranded sections (s1, s2, s3) for the pseudoknot whose entropic free energy is given in Eq. 1; it corresponds to the main pseudoknotted scaffold of the HDV ribozyme (a). (c) The secondary structure of the ribozyme (black) plus attenuator (blue) as it presumably occurs in the HDV genome, except during replication. It corresponds to the absolute free energy minimum obtained by Zuker (ref. ; http://mfold2.wustl.edu/∼mfold/rna/form1.cgi). Figs. 4, 5, and 7 are drawn by using RnaViz (15).
Figure 5
Figure 5
The two competing sets of stems that define the rapid and trapped folding pathways during synthesis. The native stem P1 will tend to nucleate once the first 32 nt are made, provided the current configuration (not drawn) consists of P0 and P5. However when the available sequence is between 26 nt and 31 nt long—i.e., before P1 can nucleate—the alternative stem P6 can form on the structure in conjunction with P0′ (not drawn), and may then become stabilized by another nonnative strong stem, P7. In this event, an inactive misfolded ribozyme is eventually formed at the end of synthesis. It typically consists of stems P6, P4, and P2 plus a sampling of other stems and nucleates P1 only much later if the attenuator is not present. (The same three stems also delineate the trapped species following a quench.) P8 acts as a “folding guide” for both pathways and is easily removed as soon as P4 nucleates and displaces it (see last structures drawn).
Figure 6
Figure 6
Chart of helices present in the ribozyme plus attenuator sequence as it folds during and after synthesis for a molecule that folds via the catalytic folding path in Fig. 5 (red), and a molecule following the main noncatalytic path in Fig. 5 (green). At each time, a point is marked for the 3′ end of all helices present on the structure (with red and green slightly offset), thus isolated points are transient helices and continuous lines, stable ones. Synthesis is complete at 4 s, and the labeled stems follow the numbering of Fig. 5. The last intermediate structures drawn in Fig. 5, when the top of P4 has just nucleated and starts displacing P8, correspond to the time indicated by the arrow.
Figure 7
Figure 7
The secondary structure corresponding to the red curve at 10 s in Fig. 6 (i.e., catalytic path). The native ribozyme stems are still present, but various single-stranded regions (red) have already paired with the attenuator sequence (blue), presumably preventing further catalytic activity.

References

    1. Brion P, Westhof E. Annu Rev Biophys Biomol Struct. 1997;26:113–137. - PubMed
    1. Nussinov R, Jacobson A B. Proc Natl Acad Sci USA. 1980;77:7826–7830. - PMC - PubMed
    1. Rivas E, Eddy S R. J Mol Biol. 1999;285:2053–2068. - PubMed
    1. Mironov A A, Dyakonova L P, Kister A E. J Biomol Struct Dyn. 1985;2:953–962. - PubMed
    1. Pörschke D. Biophys Chem. 1974;1:381–386. - PubMed

Publication types

LinkOut - more resources