

Comparison of a new colorimetric assay with the NCCLS broth microdilution method (M-27A) for antifungal drug MIC determination
- PMID: 10834998
- PMCID: PMC86796
- DOI: 10.1128/JCM.38.6.2334-2338.2000
Comparison of a new colorimetric assay with the NCCLS broth microdilution method (M-27A) for antifungal drug MIC determination
Abstract
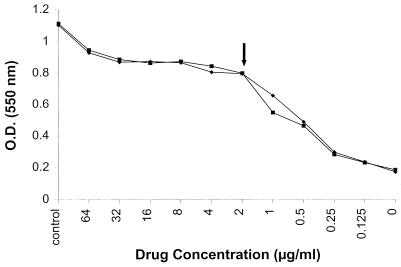
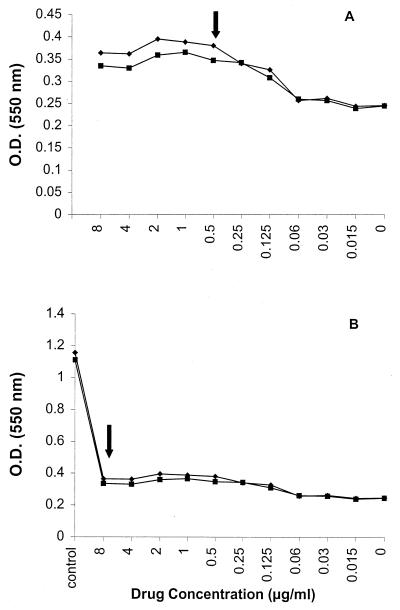
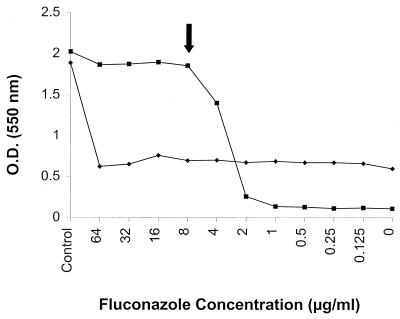
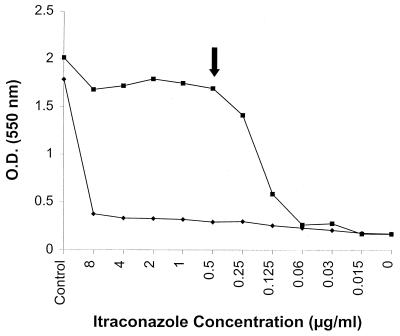
We evaluated a new microtiter assay for antifungal susceptibility testing based on a colorimetric reaction to monitor fungal substrate utilization. This new method (rapid susceptibility assay [RSA]) provides quantitative endpoint readings in less than 8 h compared with visual determination of MIC by the National Committee for Clinical Laboratory Standards (NCCLS) broth microdilution method, which requires a minimum of 48 h of incubation. In this study, we tested clinical isolates from each of the following species: Candida albicans (20 isolates), C. glabrata (20 isolates), C. krusei (19 isolates), C. tropicalis (19 isolates), and C. parapsilosis (28 isolates). RSA and NCCLS broth dilution methods were used to determine the MICs of amphotericin B, fluconazole, itraconazole, and 5-flucytosine for all 106 isolates. RPMI 1640 medium buffered with morpholinopropanesulfonic acid was used for both methods; however, glucose and inoculum concentrations in the RSA were modified. RSA MICs were determined as the lowest drug concentration that prevented glucose consumption by the organism after 6 h of incubation. MICs obtained from the RSA were compared with those obtained from the NCCLS M-27A method read at 24 and 48 h. MIC pairs were considered in agreement when the difference between the pairs was within 2 twofold dilutions. For the 106 isolates tested, amphotericin B and 5-flucytosine demonstrated the highest agreement in MICs between the two methods (100 and 98%, respectively), whereas fluconazole and itraconazole produced less favorable MIC agreement (63.2 and 61.3%, respectively). The azole MIC differences between the two methods were significantly reduced when lower inocula were used with a prolonged incubation time. This preliminary comparison suggests that this rapid procedure may be a reliable tool for the in vitro determination of MICs of amphotericin B and 5-flucytosine and warrants further evaluation.
Figures


References
-
- Espinel-Ingroff A, Pfaller M A. Antifungal agents and susceptibility testing. In: Murray P R, Baron E J, Pfaller M A, Tenover F C, Yolken R H, editors. Manual of clinical microbiology. 6th ed. Washington, D.C.: American Society for Microbiology; 1995. pp. 1405–1414.
-
- Fromtling R A, Galgiani J N, Pfaller M A, Espinel-Ingroff A, Bartizal K F, Bartlett M S, Body B A, Frey C, Hall G, Roberts G D, Nolte F B, Odds F C, Rinaldi M G, Sugar A M, Villareal K. Multicenter evaluation of a broth macrodilution antifungal susceptibility test for yeasts. Antimicrob Agents Chemother. 1993;37:39–45. - PMC - PubMed
-
- National Committee for Clinical Laboratory Standards. Reference method for broth dilution antifungal susceptibility testing of yeasts. Approved standard. Document M-27A. Wayne, Pa: National Committee for Clinical Laboratory Standards; 1997.
Publication types
MeSH terms
Substances
LinkOut - more resources
Full Text Sources
