Comparative Study
. 2000 Jun 1;525 Pt 2(Pt 2):405-18.
doi: 10.1111/j.1469-7793.2000.t01-3-00405.x.

Differences in Ca2+ buffering properties between excitatory and inhibitory hippocampal neurons from the rat

Affiliations
Comparative Study

Differences in Ca2+ buffering properties between excitatory and inhibitory hippocampal neurons from the rat

S H Lee et al. J Physiol. .

Abstract

Endogenous calcium binding ratios (kappaS) in dendrites of cultured hippocampal neurons were estimated according to the single compartment model for transients in intracellular Ca2+ concentration ([Ca2+]). In addition, the electrophysiological characteristics of neurons were classified by their autaptic currents and intrinsic firing patterns. These data were analysed in order to determine whether a correlation between Ca2+ buffers and electrophysiological type exists. Ca2+ binding ratios of endogenous buffers were estimated by eliciting [Ca2+] transients with short depolarizations, while cells were loaded with fura-2. Two types of estimates could be obtained: one termed kappaS(tau), based on analysing time constants (tau) of [Ca2+] transients, and another termed kappaS(dCa), derived from an analysis of initial amplitudes of [Ca2+] transients. Values for kappaS(tau) and kappaS(dCa) were estimated as 57 +/- 10 (mean +/- s.d., n = 10) and 60 +/- 14 (n = 10), respectively, in excitatory neurons, and 130 +/- 50 (n = 11) and 150 +/- 70 (n = 11), respectively, in inhibitory neurons. The kappaS values of excitatory and inhibitory cells were significantly different from each other, regardless of the measurement method (Student's t test, P < 0.01). However, there was no significant difference in kappaS between the groups classified according to firing patterns. Although kappaS(tau) values were well matched to those of kappaS(dCa) in most excitatory cells, the two values did not agree in three out of the fourteen inhibitory cells investigated. In these cells, the first few [Ca2+] transients after obtaining the whole cell configuration displayed a double exponential decay, suggesting that buffers with slow binding kinetics, such as parvalbumin, are involved. This hypothesis is further explored in an accompanying paper.


Figures

Figure 1
Figure 1. Representative example of excitatory (A) and inhibitory (B) autaptic currents
Glutamatergic and GABAergic currents were blocked by superfusion of the cells with 10 μM NBQX and 20 μM bicuculline, respectively (dotted traces, which are closer to the x-axis in both cases).
Figure 2
Figure 2. Composed line profile images for examining spatial homogeneity
Aa, hippocampal cultured neuron loaded with 150 μm fura-2 from a somatic patch pipette. Scale bar % 20 μm. Ab, ΔF/F image reconstructed from a time series (y-axis) of line profiles along the dendrite (x-axis) as described below. The horizontal axis represents distance along the line profile, while the vertical axis shows time. For the sixth image, a 3 ms depolarization was applied through the pipette to the soma (marked with ▾), and images were sampled every 20 ms at 380 nm exitation. During offline analysis, two lines of interest (LOI) were drawn: one was along the dendrite (marked with × in A) for Fdend (fluorescence of dendrite), and the other was 25 pixels away from the cell margin for Fb (background fluorescence). The difference Fdend(x) - Fb(x), obtained by pointtopoint subtraction, was regarded as real fluorescence originating from fura-2 (Ffura2). The line profile of fura-2 fluorescence at the resting state (Frest(x)) was calculated by timeaveraging the first 5 line profiles before depolarization. Finally, ΔF/F as a percentage value was calculated according to 100 × [{Ffura2(x) - Frest(x)}/Frest(x)], and the time series of ΔF/F line profiles were combined to construct the image illustrated. The × marks on the lower LOI in the F380 image (Aa) correspond to the triangles (▴) on the x-axis of Ab. Ac, line profile along a LOI on a dendrite just after the depolarization. The values at each pixel were obtained by averaging ΔF/F values at corresponding pixels in 5 temporally consecutive line profiles. Ba, fluorescence image of a hippocampal cultured neuron, which has an excitatory autaptic current (1·0 nA, data not shown). Scale bar % 20 μm. Bb and c were obtained as described in Ab and c. Again, for the sixth image, a 3 ms depolarization was applied through the pipette to the soma (marked with ▾) and images were sampled every 100 ms at 380 nm excitation.
Figure 3
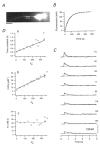
Figure 3. Representative examples for measurements of κS in an excitatory neuron
Aa, fura-2 fluorescence image of a hippocampal cultured neuron. The image was taken 14 min after establishment of the whole cell configuration with excitation at 380 nm (20 ms exposure). This cell had been cultured for 14 days. Its electrophysiological properties were classified as those of a regularly spiking excitatory cell (fmax= 30 Hz, a= 46 %). Two ROIs (marked ROI1 and ROI2) were chosen for the measurement of dendritic fluorescence at 26 and 43 μm (ROI1 and ROI2, respectively) from the margin of the soma. Two adjacent ROIs were selected for background fluorescence (Fb). Scale bar = 20 μm. Ab, time course of isosbestic fluorescence (Fiso) in ROI1 (•) and ROI2 (○) during whole cell patch recording with a somatic pipette containing 150 μM fura-2. The abscissa represents the time elapsed after break-in (s). The left and right ordinates represent fluorescence from ROI1 and ROI2, respectively. Both ordinates have the same units (adu, which refers to analog-to-digital units of the CCD camera). The first point (at t= 0) was taken in the cell-attached configuration and was regarded as the autofluorescence from the dendrite in the ROI. Exponential curves (continuous lines) were fitted to Fiso of ROI1 and ROI2 with time constants of 149.5 and 188.7 s, respectively. Ac, plot of the decay time constants (τ) of [Ca2+] transients (shown in B) against the incremental calcium binding ratio of fura-2 (κB‘) evaluated at the same time point. The x-axis intercepts of the regression lines fitted to τ values of ROI1 (•, continuous line) and ROI2 (○, dotted line) were 51.8 and 56.5, respectively, and provide values designated as κS(τ) for ROI1 and ROI2, respectively. Ad, plot of the inverse of the [Ca2+] transient amplitudes as a function of κB‘. Based on eqn (8), κS(dCa) values for ROI1 (•, continuous regression line) and for ROI2 (○, dotted line) were estimated to be 54.0 and 69.7, respectively. The 3 points with the highest κB′ from each ROI were excluded from the fit. Ae, plot of the product AτversusκB‘, showing the lack of dependence of Aτ on κB‘. B, dendritic [Ca2+] transients measured in the two ROIs. The 8 exemplar [Ca2+] transients shown here were obtained by 3 ms depolarizations evoked during the period marked in the loading curve (Ab, between 26 and 242 s after break-in). The numbers between the two columns denote the whole cell recording time in seconds (the time elapsed after the whole cell configuration was established).
Figure 5
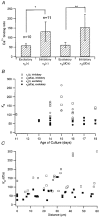
Figure 5. Summary of endogenous Ca2+ binding ratios estimated in excitatory and inhibitory hippocampal cultured neurons
A, graphic representation of mean κS(τ) and κS(dCa) values measured in excitatory and inhibitory cells. Error bars represent s.d. Statistical comparison of values from excitatory and inhibitory neurons revealed statistically significant differences (P < 0.01) for both κS(τ) (*) and κS(dCa) (**) values. B, plot of κSversus culture age of neurons. No statistically significant dependence on age is resolved within the range of ages investigated. C, plot of κS(dCa) versus the distance of the ROI from the margin of the soma. The κS(dCa) values were measured in 27 different ROIs from 10 excitatory cells (▪) and 24 different ROIs from 11 inhibitory cells (□). All κS values marked with * were measured in the same cell. The ROI of the value at 30 μm was set on a branching point while the others were located on the dendritic shaft.
Figure 4
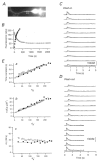
Figure 4. Representative example for κS estimation in an inhibitory neuron
A, fluorescence image of an inhibitory hippocampal cultured neuron (culture age was 17 days). [Ca2+] transients were obtained from the average fluorescence of a ROI, set on the dendrite. Another ROI was selected for background fluorescence (Fb). Scale bar = 20 μm. B, time course of isosbestic fluorescence (Fiso) of the ROI during whole cell patch recording with a somatic pipette containing 150 μM fura-2. Both axes have the same meaning as those of the loading curves shown in Fig. 3. Fura-2 diffused into the ROI with a time constant of 137.5 s, as calculated from the loading curve. C, dendritic [Ca2+] transients measured in the ROI. The 9 exemplar [Ca2+] transients were evoked by 3 ms depolarizations between 24 and 249 s after break-in. The numbers at the right side of each [Ca2+] transient denote the whole cell recording time in seconds. D, estimation of κS in the ROI. Da, plot of time constants (τ) of the decay in [Ca2+] transients (shown in C) against the incremental Ca2+ binding ratio of fura-2 (κB‘) evaluated at the same time point. The κS(τ), measured as the x-axis intercept of the regression line fitted to τ values (continuous line) was 130. Db, plot of the inverse of [Ca2+] transient amplitudes as a function of κB′ based on eqn (8), where κS(dCa) was estimated to be 138. The last point was excluded from the linear fits to τ and 1/dCa. Dc, plot of the product AτversusκB‘.
Figure 6
Figure 6. Loading and unloading with fura-2
A, fura-2 fluorescence image of an excitatory cell under study taken at the end of the first whole cell patch recording (excitation 380 nm, 20 ms exposure). The ROI on the dendrite was set 15 μm distal to the root of the dendrite. Scale bar = 20 μm. B, fura-2 loading curve during the first (•) and the second (○) somatic whole cell episode using pipettes containing 150 and 17.5 μM fura-2, respectively. C and D, [Ca2+] transients evoked during the first (wash-in phase) and the second (wash-out phase) whole cell recording. All transients elicited during the wash-in phase, and 13 transients during the wash-out phase are shown. E, analysis of the [Ca2+] transients. Two sets of data obtained from wash-in (•) and wash-out phases (○) were superimposed as in Fig. 4D. Ea, κS(τ) values were estimated as 53.26 and 67.7 in wash-in and wash-out phases, repectively. The last 6 points in the plot were excluded from the fit. Eb, κS(dCa) values were estimated as 55.75 and 49.3 in wash-in and in wash-out phases, respectively. Ec, plot of AτversusκB‘.
Figure 7
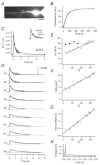
Figure 7. An anomalous case
A, fura-2 fluorescence image of the anomalous cell (excitation 380 nm, exposure 20 ms). A ROI was set at a distance of about 33 μm from the margin of the soma. The cell had been cultured for 12 days and showed inhibitory autaptic currents. The fluorescence originating from the patch pipette is also shown as a triangular shadow on the far right-hand side. Scale bar = 20 μm. B, the time course of Fiso from the ROI during a somatic whole cell recording with 150 μM fura-2. The exponential curve fit (continuous line) has a time constant of 120 s. C, a representative example of a double exponential fit to a [Ca2+] transient. The [Ca2+] transient was evoked at 35 s after break-in. Its decay phase was fitted both with single (dotted curve) and double (continuous curve) exponential fits according to: 10 nM + (108.6 nM × exp(-2.21t)) for the former, 10 nM + (25.4 nM × exp(-0.47t)) + (95.0 nM × exp(-3.82t)) for the latter, where t is given in seconds. The time integrals of single and double exponential curves were 0.049 and 0.079 μM s, respectively. The resting [Ca2+] level at the next transient, which was evoked 17 s later, is marked with a triangle (▴) at the end of the fitted curve. In the inset, the same [Ca2+] trace with exponential fits is depicted on an expanded time scale. D, the first 10 [Ca2+] transients evoked between 18 and 240 s after break-in. The numbers in front of Ca2+ traces represent the whole cell recording times (s) at which records were taken. The second [Ca2+] transient is illustrated on a compressed time scale in C. Single (dotted curve) and double (continuous curve) exponential fits were superimposed on the [Ca2+] transients. The following equations were used for the double exponential fitting to the first, third and fourth [Ca2+] transients:respectively. E, plot of time integrals of single (○) and double (•) exponential fits. The first 4 time integrals derived from double exponential fits, combined with the 6 Aτ values at later times, show less dependence on κB′ than the time integrals of single exponential fits only (note slopes of lines fitted to the former and the latter; they are 0.022 and 0.17 nM s, respectively). F, plot of 1/dCa as a function of κB‘. The x-axis intercept of the line fitted to the data points revealed a κS(dCa) of 171.3. G, plot of decay time constant τ as a function of κB‘. The x-axis intercept of the line (continuous line) fitted to all τ values revealed a κS(τ) of 29.7. H, an action potential evoked by a depolarizing current injection (3 ms, 500 pA) via a somatic patch pipette in current clamp mode.
Figure 8
Figure 8. Micrograph of PV-immunoreactive neurons from rat hippocampal culture
Pyramidal-like basket cells (arrows) with relatively large somata and many processes were observed in the culture dishes. A second population of cells with small cell bodies and few fine processes (arrowheads) were reminiscent of the second group of PV-immunoreactive cells found in the CA1 region in vivo (Nitsch et al. 1990). Scale bar, 100 μm.m

References

    1. Baimbridge K, Celio M, Rogers J. Calcium-binding proteins in the nervous system. Trends in Neurosciences. 1992;15:303–308. - PubMed
    1. Baimbridge K, Miller J. Immunohistochemical localization of calcium-binding protein in the cerebellum, hippocampal formation, and olfactory bulb of the rat. Brain Research. 1982;245:223–229. - PubMed
    1. Bekkers J, Stevens C. Excitatory and inhibitory autaptic currents in isolated hippocampal neurones maintained in cell culture. Proceedings of the National Academy of Sciences of the USA. 1991;88:7834–7838. - PMC - PubMed
    1. Celio MR. Parvalbumin in most γ-aminobutyric acid-containing neurons of the rat cerebral cortex. Science. 1986;231:995–997. - PubMed
    1. Connors B, Gutnick M. Intrinsic firing patterns of diverse neocortical neurons. Trends in Neurosciences. 1990;13:99–104. - PubMed

Publication types

LinkOut - more resources