. 2000 Jun 1;19(11):2710-8.
doi: 10.1093/emboj/19.11.2710.

Three-dimensional cryo-electron microscopy localization of EF2 in the Saccharomyces cerevisiae 80S ribosome at 17.5 A resolution

Affiliations

Three-dimensional cryo-electron microscopy localization of EF2 in the Saccharomyces cerevisiae 80S ribosome at 17.5 A resolution

M G Gomez-Lorenzo et al. EMBO J. .

Abstract

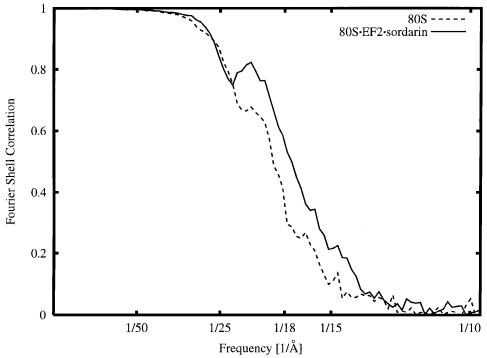
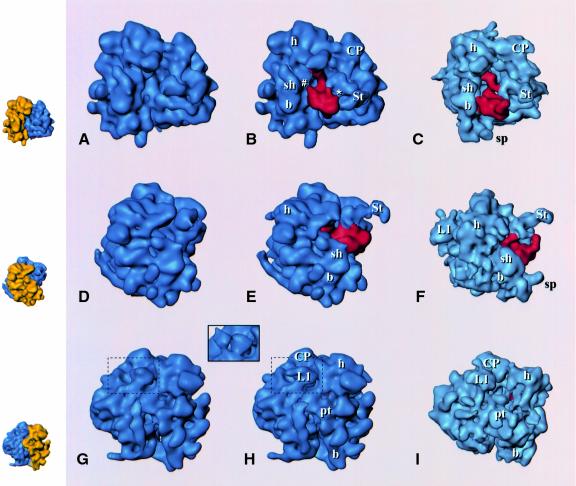
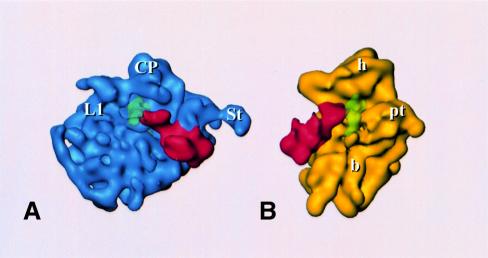
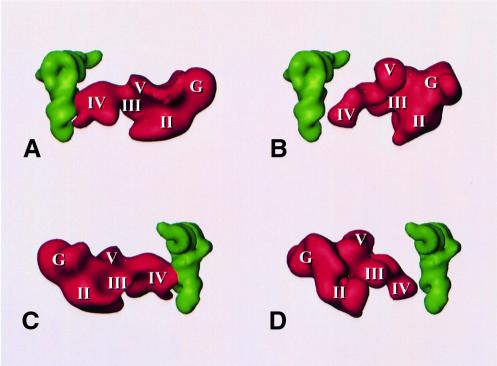
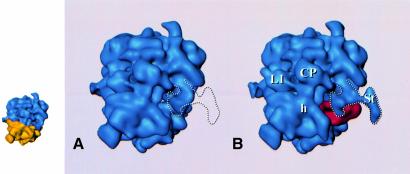
Using a sordarin derivative, an antifungal drug, it was possible to determine the structure of a eukaryotic ribosome small middle dotEF2 complex at 17.5 A resolution by three-dimensional (3D) cryo-electron microscopy. EF2 is directly visible in the 3D map and the overall arrangement of the complex from Saccharomyces cerevisiae corresponds to that previously seen in Escherichia coli. However, pronounced differences were found in two prominent regions. First, in the yeast system the interaction between the elongation factor and the stalk region of the large subunit is much more extensive. Secondly, domain IV of EF2 contains additional mass that appears to interact with the head of the 40S subunit and the region of the main bridge of the 60S subunit. The shape and position of domain IV of EF2 suggest that it might interact directly with P-site-bound tRNA.


Figures

None
Fig. 1. Fourier shell correlation curve, indicating a resolution of 17.5 Å with a 0.5 cut-off criterion for the 80S⋅EF2⋅sordarin complex (solid line) and 18.9 Å for the vacant 80S ribosome (dashed line).
None
Fig. 2. Reconstructions of the 80S ribosome from S.cerevisiae without (A, D, G) and with (B, E, H) EF2 bound, and the EF-G-bound 70S ribosome from E.coli (C, F, I; adapted from Agrawal et al., 1999), presented in three equivalent views. Upper row (AC): side view, with small subunit on the left and large subunit on the right, showing the binding sites of the elongation factors; middle row (DF): view from the small subunit solvent side, with (E) and (F) showing the extended stalk (St); bottom row (GI): view from the L1 protein side. The inset above (G) and (H) shows a comparison of the L1 region [within the dashed boundary in (G) and (H)] with the ‘split’ appearance of L1 in the yeast ribosome in a previous reconstruction (Beckmann et al., 1997). EF2 and EF-G are shown in red. Small insets on the left depict the 80S control map with 40S and 60S colored in yellow and blue, respectively, in corresponding orientations as an interpretation aid. Landmarks, small subunit: h, head; b, body; pt, platform; sh, shoulder (for the designation of subunit body, see Figure 3; large subunit: CP, central protuberance; L1, L1 protuberance; St, extended stalk.
None
Fig. 3. Reconstruction of EF2-bound 80S ribosome, split into the 60S (A) and 40S (B) subunit, each shown with EF2; P-site-bound tRNA is also shown (green, transparent) in a position inferred by analogy to its experimental localization in E.coli (Malhotra et al., 1998). Landmarks are the same as in Figure 2.
None
Fig. 4. Relative arrangements of (A and C) P-site tRNA and EF2 in the 80S ribosome (with tRNA placed into the 80S density map in a position equivalent to its observed position in the fMet-tRNAfMet–70S ribosome map of Malhotra et al., 1998) and (B and D) P-site tRNA (Malhotra et al., 1998) and EF-G (Agrawal et al., 1998) in the 70S ribosome. Roman numerals I–V and G mark the domains in EF-G and homologous domains in EF2 according to the model of Capa et al. (1998).
None
Fig. 5. Top view of the 80S ribosome (A) without and (B) with EF2 bound, indicating the structural rearrangement of the stalk region. The outline of the stalk region in the 80S⋅EF2⋅sordarin complex is indicated by the white dashed line. Small inset on the left: control map (A) with 40S and 60S colored in yellow and blue, respectively, as an interpretation aid.

References

    1. Abel K. and Jurnak,F. (1996) A complex profile of protein elongation: translating chemical energy into molecular movement. Structure, 4, 229–238. - PubMed
    1. Ævarsson A., Brazhnikov,E., Garber,M., Zheltonosova,J., Chirgadze,Y., Al-Karadaghi,S., Svensson,L.A. and Liljas,A. (1994) Three-dimensional structure of the ribosomal translocase: elongation factor G from Thermus thermophilus. EMBO J., 13, 3669–3677. - PMC - PubMed
    1. Agrawal R.K., Penczek,P., Grassucci,R.A. and Frank,J. (1998) Visualization of elongation factor G on the Escherichia coli 70S ribosome: the mechanism of translocation. Proc. Natl Acad. Sci. USA, 95, 6134–6138. - PMC - PubMed
    1. Agrawal R.K., Heagle,A.B., Penczek,P., Grassucci,R.A. and Frank,J. (1999) EF-G-dependent GTP hydrolysis induces translocation accompanied by large conformational changes in the 70S ribosome. Nature Struct. Biol., 6, 643–647. - PubMed
    1. Agrawal R.K., Heagle,A.B. and Frank,J. (2000) Studies of elongation factor G-dependent tRNA translocation by three-dimensional cryo-electron microscopy. In Garrett,R.A., Douthwaite,S.R., Liljas,A., Matheson,A.T., Moore,P.B. and Noller,H.F. (eds), The Ribosome: Structure, Function, Antibiotics and Cellular Interactions. ASM Press, Washington, DC, pp. 53–62.

Publication types

MeSH terms