. 2000 Jun 1;14(11):1319-31.

gamma-catenin is regulated by the APC tumor suppressor and its oncogenic activity is distinct from that of beta-catenin

Affiliations

gamma-catenin is regulated by the APC tumor suppressor and its oncogenic activity is distinct from that of beta-catenin

F T Kolligs et al. Genes Dev. .

Abstract

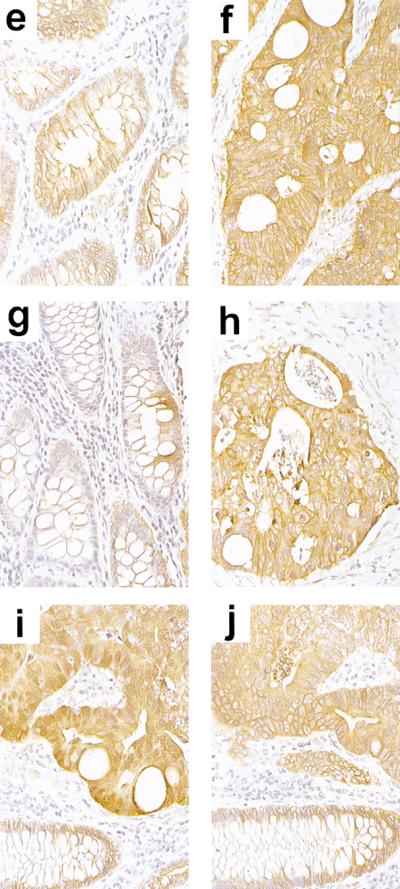
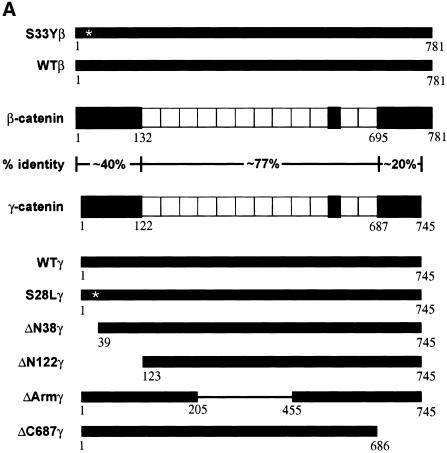
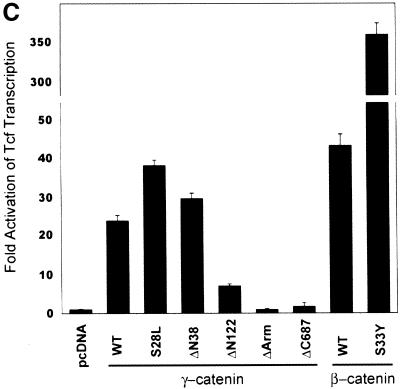
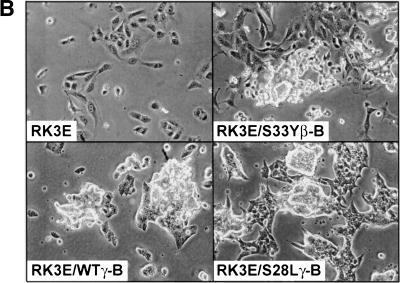
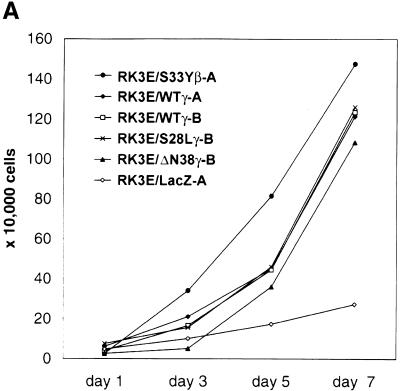
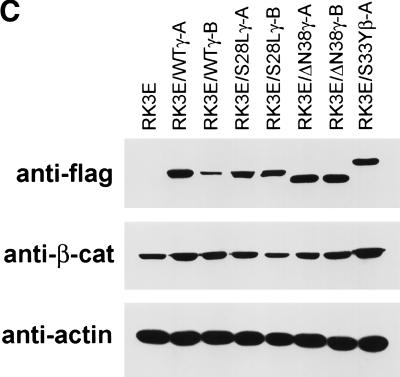
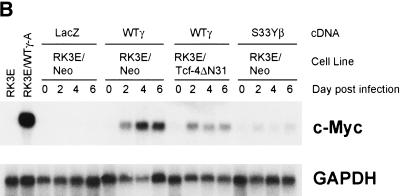
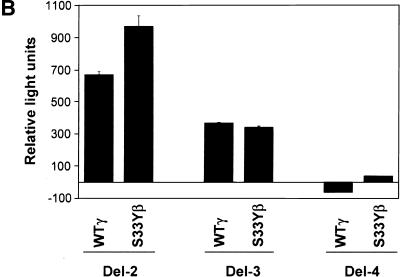
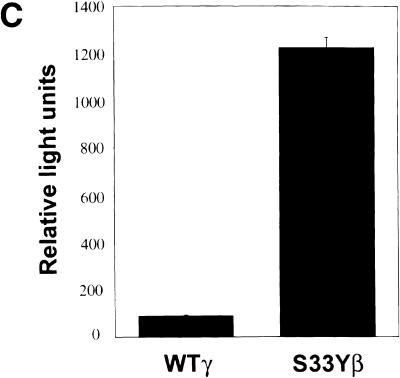
beta-Catenin and gamma-catenin (plakoglobin), vertebrate homologs of Drosophila armadillo, function in cell adhesion and the Wnt signaling pathway. In colon and other cancers, mutations in the APC tumor suppressor protein or beta-catenin's amino terminus stabilize beta-catenin, enhancing its ability to activate transcription of Tcf/Lef target genes. Though beta- and gamma-catenin have analogous structures and functions and like binding to APC, evidence that gamma-catenin has an important role in cancer has been lacking. We report here that APC regulates both beta- and gamma-catenin and gamma-catenin functions as an oncogene. In contrast to beta-catenin, for which only amino-terminal mutated forms transform RK3E epithelial cells, wild-type and several amino-terminal mutated forms of gamma-catenin had similar transforming activity. gamma-Catenin's transforming activity, like beta-catenin's, was dependent on Tcf/Lef function. However, in contrast to beta-catenin, gamma-catenin strongly activated c-Myc expression and c-Myc function was crucial for gamma-catenin transformation. Our findings suggest APC mutations alter regulation of both beta- and gamma-catenin, perhaps explaining why the frequency of APC mutations in colon cancer far exceeds that of beta-catenin mutations. Elevated c-Myc expression in cancers with APC defects may be due to altered regulation of both beta- and gamma-catenin. Furthermore, the data imply beta- and gamma-catenin may have distinct roles in Wnt signaling and cancer via differential effects on downstream target genes.


Figures

Figure 1
Figure 1
APC regulates β- and γ-catenin in colon cancer. (a–d) Regulation of β- and γ-catenin by APC in HT29 colon cancer cells. β- and γ-catenin expression were assessed by immunofluorescence in the HT29–APC colon cancer line, which carries truncating mutations in both endogenous APC alleles but can be induced to express wild-type APC following zinc exposure. At baseline, γ- and β-catenin (a,c, respectively) were localized at the membrane, as well as diffusely throughout the cytoplasm and nucleus. Following a 6-hr exposure to 150 μm zinc to induce APC expression, the cytoplasmic and nuclear levels of γ- and β-catenin were considerably reduced in >60% of cells (b,d, respectively), with both proteins showing predominantly a membrane localization. The cells were photographed at 400× magnification, and exposure times were identical for panels obtained with the same primary antibody [(a,b) γ-catenin; (c,d) β-catenin]. (e–j) Representative examples of immunohistochemical analysis of β- and γ-catenin expression in normal and malignant colorectal tissues. Expression in colorectal carcinoma specimen #T-41 (f,h) and adjacent normal colonic cells from the same case (e,g). Serial sections from a region of specimen #T-49 containing both carcinoma (top) and normal colonic mucosa (bottom) are shown in i and j. β-Catenin staining is shown in e, f, and i; γ-catenin staining is shown in g, h, and j. Whereas β- and γ-catenin were predominantly localized to the membrane in normal colonic mucosa cells, increased cytoplasmic staining for β- and γ-catenin was seen in carcinoma cells. Nuclear staining for β-catenin is seen in i, but no nuclear staining for γ-catenin is seen. The slides were photographed at 400×.
Figure 1
Figure 1
APC regulates β- and γ-catenin in colon cancer. (a–d) Regulation of β- and γ-catenin by APC in HT29 colon cancer cells. β- and γ-catenin expression were assessed by immunofluorescence in the HT29–APC colon cancer line, which carries truncating mutations in both endogenous APC alleles but can be induced to express wild-type APC following zinc exposure. At baseline, γ- and β-catenin (a,c, respectively) were localized at the membrane, as well as diffusely throughout the cytoplasm and nucleus. Following a 6-hr exposure to 150 μm zinc to induce APC expression, the cytoplasmic and nuclear levels of γ- and β-catenin were considerably reduced in >60% of cells (b,d, respectively), with both proteins showing predominantly a membrane localization. The cells were photographed at 400× magnification, and exposure times were identical for panels obtained with the same primary antibody [(a,b) γ-catenin; (c,d) β-catenin]. (e–j) Representative examples of immunohistochemical analysis of β- and γ-catenin expression in normal and malignant colorectal tissues. Expression in colorectal carcinoma specimen #T-41 (f,h) and adjacent normal colonic cells from the same case (e,g). Serial sections from a region of specimen #T-49 containing both carcinoma (top) and normal colonic mucosa (bottom) are shown in i and j. β-Catenin staining is shown in e, f, and i; γ-catenin staining is shown in g, h, and j. Whereas β- and γ-catenin were predominantly localized to the membrane in normal colonic mucosa cells, increased cytoplasmic staining for β- and γ-catenin was seen in carcinoma cells. Nuclear staining for β-catenin is seen in i, but no nuclear staining for γ-catenin is seen. The slides were photographed at 400×.
Figure 2
Figure 2
Expression of wild-type and mutated γ- and β-catenin proteins and their effects on Tcf transcription in 293 cells. (A) Schematic illustration of the structure of 745-amino-acid γ-catenin and 781-amino-acid β-catenin proteins; the percentage identity of sequences in different regions of the proteins; and the γ- and β-catenin proteins encoded by the expression constructs used in this work. The 12 armadillo repeats in the highly conserved central regions of γ- and β-catenin are indicated by open boxes. In addition to wild-type γ- and β-catenin, several mutant proteins were expressed. Asterisks (*) indicate the position of point mutations (i.e., S33Yβ and S28Lγ), and the thin line indicates the region of γ-catenin affected by an in-frame deletion in the ΔArmγ construct. All γ- and β-catenin proteins were modified to contain carboxy-terminal Flag epitope tags. (B) Expression of wild-type and mutated γ- and β-catenin proteins. ECL–Western blot analysis with an anti-Flag antibody was carried out on whole-cell lysates prepared 48 hr after transfection of 293 cells with pcDNA3 constructs encoding the γ- and β-catenin proteins. To confirm equal loading and transfer of proteins, blots were stripped and ECL–Western blotting with an anti-actin antibody was performed. (C) Activation of Tcf transcription by wild-type and mutated forms of γ- and β-catenin in 293 cells following transfection of pcDNA3 constructs. The ratios of luciferase activities from the wild-type Tcf reporter (pTOPFLASH) and a mutant Tcf reporter gene construct (pFOPFLASH) were determined 48 hr after transfection. Luciferase activities were normalized for transfection efficiency by cotransfection with a β-galactosidase-expressing vector. Tcf activation relative to that obtained with empty pcDNA3 vector is shown. The mean values and standard deviations from three experiments are shown.
Figure 2
Figure 2
Expression of wild-type and mutated γ- and β-catenin proteins and their effects on Tcf transcription in 293 cells. (A) Schematic illustration of the structure of 745-amino-acid γ-catenin and 781-amino-acid β-catenin proteins; the percentage identity of sequences in different regions of the proteins; and the γ- and β-catenin proteins encoded by the expression constructs used in this work. The 12 armadillo repeats in the highly conserved central regions of γ- and β-catenin are indicated by open boxes. In addition to wild-type γ- and β-catenin, several mutant proteins were expressed. Asterisks (*) indicate the position of point mutations (i.e., S33Yβ and S28Lγ), and the thin line indicates the region of γ-catenin affected by an in-frame deletion in the ΔArmγ construct. All γ- and β-catenin proteins were modified to contain carboxy-terminal Flag epitope tags. (B) Expression of wild-type and mutated γ- and β-catenin proteins. ECL–Western blot analysis with an anti-Flag antibody was carried out on whole-cell lysates prepared 48 hr after transfection of 293 cells with pcDNA3 constructs encoding the γ- and β-catenin proteins. To confirm equal loading and transfer of proteins, blots were stripped and ECL–Western blotting with an anti-actin antibody was performed. (C) Activation of Tcf transcription by wild-type and mutated forms of γ- and β-catenin in 293 cells following transfection of pcDNA3 constructs. The ratios of luciferase activities from the wild-type Tcf reporter (pTOPFLASH) and a mutant Tcf reporter gene construct (pFOPFLASH) were determined 48 hr after transfection. Luciferase activities were normalized for transfection efficiency by cotransfection with a β-galactosidase-expressing vector. Tcf activation relative to that obtained with empty pcDNA3 vector is shown. The mean values and standard deviations from three experiments are shown.
Figure 3
Figure 3
Neoplastic transformation of RK3E cells by γ-catenin. (A) Focus formation assay in RK3E. RK3E cells were infected with retroviruses encoding wild-type or mutated forms of γ- and β-catenin. Indicated in each panel is the protein encoded by the retrovirus used for infection of the cells. Four weeks after infection, the plates were stained and foci photographed. Representative plates from four or more independent experiments performed on each γ- and β-catenin construct are shown. (B) Morphology of parental RK3E cells, one β-catenin, and two γ-catenin transformed cell lines. Magnification for all panels, 200×.
Figure 3
Figure 3
Neoplastic transformation of RK3E cells by γ-catenin. (A) Focus formation assay in RK3E. RK3E cells were infected with retroviruses encoding wild-type or mutated forms of γ- and β-catenin. Indicated in each panel is the protein encoded by the retrovirus used for infection of the cells. Four weeks after infection, the plates were stained and foci photographed. Representative plates from four or more independent experiments performed on each γ- and β-catenin construct are shown. (B) Morphology of parental RK3E cells, one β-catenin, and two γ-catenin transformed cell lines. Magnification for all panels, 200×.
Figure 4
Figure 4
Analysis of γ-catenin transformed RK3E lines. (A) Growth of γ-catenin-transformed RK3E lines in medium with 0.5% FBS. Cells (2 × 104) were initially seeded in 35-mm dishes in the presence of medium containing 10% FBS, then changed to medium with 0.5% FBS 24 hr later. Cells were trypsinized and counted at the indicated time points after the switch to 0.5% FBS. One set of assays representative of three independent experiments is shown. (B) γ-Catenin-transformed RK3E lines exhibit anchorage independent growth. Colony formation in soft agar was assessed for all transformed lines by plating 1 × 104 cells of each line in 0.3% agar medium over 0.6% agar medium underlayers. After 3 weeks, the dishes were stained with methylene blue and photographed. Shown are representative assays for parental RK3E, one β-catenin transformed line (RK3E/S33Yβ-B), and four independent γ-catenin lines (RK3E/WTγ-A, RK3E/WTγ-B, RK3E/S28Lγ-B, and RK3E/ΔN38γ-B). (C) Expression of exogenous Flag epitope-tagged γ- and β-catenin proteins and endogenous β-catenin in transformed RK3E lines. Cytosolic lysates were separated by SDS-PAGE and analyzed by ECL–Western blotting. Expression of the transduced Flag epitope-tagged γ- and β-catein proteins was assessed with an anti-Flag antibody. β-Catenin levels were determined with an anti-β-catenin antibody. Equal loading of the lanes was confirmed by stripping the blots and reprobing with an anti-actin antibody. (D) Tcf/Lef transcription is markedly elevated in γ-catenin-transformed lines compared with parental RK3E cells. The ratio of luciferase activities from a Tcf-responsive reporter (pTOPFLASH) and a control luciferase reporter construct (pFOPFLASH) was determined 24 hr after transfection of the indicated γ- and β-catenin-transformed RK3E lines. Transfection efficiency was assessed with a β-galactosidase expression vector. Mean values and standard deviations from three independent experiments are shown in logarithmic scale because of the wide range of Tcf activities observed in the lines.
Figure 4
Figure 4
Analysis of γ-catenin transformed RK3E lines. (A) Growth of γ-catenin-transformed RK3E lines in medium with 0.5% FBS. Cells (2 × 104) were initially seeded in 35-mm dishes in the presence of medium containing 10% FBS, then changed to medium with 0.5% FBS 24 hr later. Cells were trypsinized and counted at the indicated time points after the switch to 0.5% FBS. One set of assays representative of three independent experiments is shown. (B) γ-Catenin-transformed RK3E lines exhibit anchorage independent growth. Colony formation in soft agar was assessed for all transformed lines by plating 1 × 104 cells of each line in 0.3% agar medium over 0.6% agar medium underlayers. After 3 weeks, the dishes were stained with methylene blue and photographed. Shown are representative assays for parental RK3E, one β-catenin transformed line (RK3E/S33Yβ-B), and four independent γ-catenin lines (RK3E/WTγ-A, RK3E/WTγ-B, RK3E/S28Lγ-B, and RK3E/ΔN38γ-B). (C) Expression of exogenous Flag epitope-tagged γ- and β-catenin proteins and endogenous β-catenin in transformed RK3E lines. Cytosolic lysates were separated by SDS-PAGE and analyzed by ECL–Western blotting. Expression of the transduced Flag epitope-tagged γ- and β-catein proteins was assessed with an anti-Flag antibody. β-Catenin levels were determined with an anti-β-catenin antibody. Equal loading of the lanes was confirmed by stripping the blots and reprobing with an anti-actin antibody. (D) Tcf/Lef transcription is markedly elevated in γ-catenin-transformed lines compared with parental RK3E cells. The ratio of luciferase activities from a Tcf-responsive reporter (pTOPFLASH) and a control luciferase reporter construct (pFOPFLASH) was determined 24 hr after transfection of the indicated γ- and β-catenin-transformed RK3E lines. Transfection efficiency was assessed with a β-galactosidase expression vector. Mean values and standard deviations from three independent experiments are shown in logarithmic scale because of the wide range of Tcf activities observed in the lines.
Figure 5
Figure 5
Tcf/Lef factors and c-Myc are required for γ-catenin transformation. Focus formation assays were carried out in parallel following infection of the RK3E/Neo, RK3E/Tcf-4ΔN31, and RK3E/MycΔ106–143 cell lines with retroviruses encoding a control LacZ protein, wild-type γ-catenin, S28L-γ-catenin, or S33Y-β-catenin. Four weeks after infection, the plates were stained and photographed. Representative portions of plates from three independent experiments are shown.
Figure 6
Figure 6
γ-Catenin, but not β-catenin, strongly activates c-Myc expression via Tcf/Lef-dependent mechanisms. (A) c-Myc expression is uniformly and markedly elevated in γ-catenin-transformed RK3E lines compared with other cell lines, including parental RK3E cells, two β-catenin-transformed RK3E lines (RK3E/S33Yβ-B and RK3E/S33Yβ-C), RK3E cells transformed by other oncogenes (RK3E/Kras and RK3E/GLI), or RK3E cells with stable expression of wild-type β-catenin (RK3E/WTβ1). Northern blot analysis of c-Myc was carried out on total RNA from the various lines. After obtaining the autoradiograph for c-Myc, the blot was stripped and hybridized to a GAPDH cDNA probe to control for loading and transfer of RNA to the membrane. (B) γ-Catenin acutely activates c-Myc expression in RK3E. RK3E/Neo and RK3E/Tcf-4ΔN31 cells were infected with the indicated retroviruses encoding control LacZ, wild-type γ-catenin, or S33Y β-catenin. Prior to infection (day 0), as well as time points of 2, 4, and 6 days post infection, cells were harvested and total RNA was isolated. Total RNA from RK3E cells and the RK3E/WTγ-A line were loaded as negative and positive controls, respectively, at left. Northern blot analyses for c-Myc expression and GAPDH were performed as in A. (C) Expression of the Flag epitope-tagged S33Y β-catenin (S33Yβ) and wild-type γ-catenin (WTγ) proteins in infected RK3E/Neo cells following infection of RK3E/Neo cells with the respective retroviruses. ECL–Western blot analysis with an anti-Flag antibody was carried out on whole-cell lysates prepared at various time points after infection. To confirm equal loading and transfer of proteins, blots were stripped and ECL–Western blotting with an anti-actin antibody was performed.
Figure 6
Figure 6
γ-Catenin, but not β-catenin, strongly activates c-Myc expression via Tcf/Lef-dependent mechanisms. (A) c-Myc expression is uniformly and markedly elevated in γ-catenin-transformed RK3E lines compared with other cell lines, including parental RK3E cells, two β-catenin-transformed RK3E lines (RK3E/S33Yβ-B and RK3E/S33Yβ-C), RK3E cells transformed by other oncogenes (RK3E/Kras and RK3E/GLI), or RK3E cells with stable expression of wild-type β-catenin (RK3E/WTβ1). Northern blot analysis of c-Myc was carried out on total RNA from the various lines. After obtaining the autoradiograph for c-Myc, the blot was stripped and hybridized to a GAPDH cDNA probe to control for loading and transfer of RNA to the membrane. (B) γ-Catenin acutely activates c-Myc expression in RK3E. RK3E/Neo and RK3E/Tcf-4ΔN31 cells were infected with the indicated retroviruses encoding control LacZ, wild-type γ-catenin, or S33Y β-catenin. Prior to infection (day 0), as well as time points of 2, 4, and 6 days post infection, cells were harvested and total RNA was isolated. Total RNA from RK3E cells and the RK3E/WTγ-A line were loaded as negative and positive controls, respectively, at left. Northern blot analyses for c-Myc expression and GAPDH were performed as in A. (C) Expression of the Flag epitope-tagged S33Y β-catenin (S33Yβ) and wild-type γ-catenin (WTγ) proteins in infected RK3E/Neo cells following infection of RK3E/Neo cells with the respective retroviruses. ECL–Western blot analysis with an anti-Flag antibody was carried out on whole-cell lysates prepared at various time points after infection. To confirm equal loading and transfer of proteins, blots were stripped and ECL–Western blotting with an anti-actin antibody was performed.
Figure 7
Figure 7
γ-Catenin activates expression from c-MYC reporter gene constructs. (A) Schematic diagram of the human c-MYC promoter region and sequences present in the Del-2, Del-3, and Del-4 reporter gene constructs of He et al. (1998). The relative location of the two TBEs is indicated. (B) Ability of wild-type γ-catenin (WTγ) and the S33Y β-catenin mutant (S33Yβ) to activate the c-MYC reporter gene constructs in 293 cells following transfection of pcDNA3 expression constructs. Luciferase activity was measured 48 hr after transfection, and activities are indicated relative to that obtained with the empty pcDNA3 vector. The mean values and standard deviations from three experiments are shown. (C) Differential activity of WTγ and S33Yβ on the TOPFLASH reporter construct in 293 cells. Luciferase activities were determined 48 hr after transfection. Mean values and standard deviations from three experiments are shown. The assays in B and C were normalized for transfection efficiency by cotransfection with the β-galactosidase expression vector pcH110.
Figure 7
Figure 7
γ-Catenin activates expression from c-MYC reporter gene constructs. (A) Schematic diagram of the human c-MYC promoter region and sequences present in the Del-2, Del-3, and Del-4 reporter gene constructs of He et al. (1998). The relative location of the two TBEs is indicated. (B) Ability of wild-type γ-catenin (WTγ) and the S33Y β-catenin mutant (S33Yβ) to activate the c-MYC reporter gene constructs in 293 cells following transfection of pcDNA3 expression constructs. Luciferase activity was measured 48 hr after transfection, and activities are indicated relative to that obtained with the empty pcDNA3 vector. The mean values and standard deviations from three experiments are shown. (C) Differential activity of WTγ and S33Yβ on the TOPFLASH reporter construct in 293 cells. Luciferase activities were determined 48 hr after transfection. Mean values and standard deviations from three experiments are shown. The assays in B and C were normalized for transfection efficiency by cotransfection with the β-galactosidase expression vector pcH110.

Similar articles

Cited by

References

    1. Barth AI, Nathke IS, Nelson WJ. Cadherins, catenins and APC protein: Interplay between cytoskeletal complexes and signaling pathways. Curr Opin Cell Biol. 1997;9:683–690. - PubMed
    1. Behrens J. Cadherins and catenins: Role in signal transduction and tumor progression. Cancer Met Rev. 1999;18:15–30. - PubMed
    1. Behrens J, von Kries JP, Kuhl M, Bruhn L, Wedlich D, Grosschedl R, Birchmeier W. Functional interaction of β-catenin with the transcription factor LEF-1. Nature. 1996;382:638–642. - PubMed
    1. Ben-Ze'ev A, Geiger B. Differential molecular interactions of β-catenin and plakoglobin in adhesion, signaling and cancer. Curr Opin Cell Biol. 1998;10:629–639. - PubMed
    1. Bienz M. APC: The plot thickens. Curr Opin Genet Dev. 1999;9:595–603. - PubMed

Publication types

MeSH terms

LinkOut - more resources