. 2000 Jun 1;14(11):1400-6.

Gross chromosomal rearrangements and genetic exchange between nonhomologous chromosomes following BRCA2 inactivation

Affiliations

Gross chromosomal rearrangements and genetic exchange between nonhomologous chromosomes following BRCA2 inactivation

V P Yu et al. Genes Dev. .

Abstract

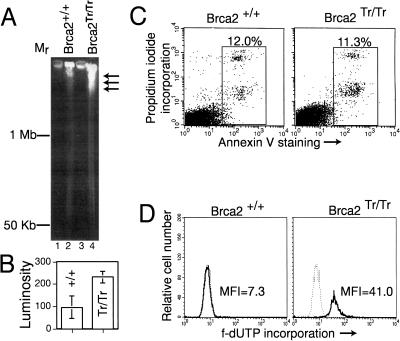
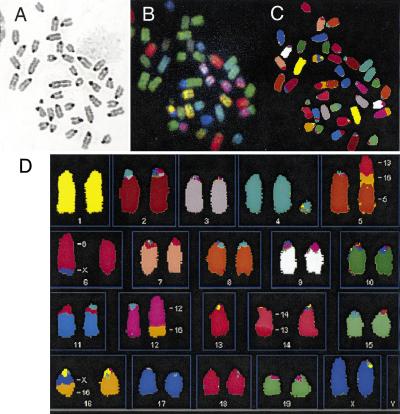
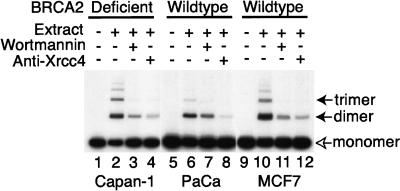
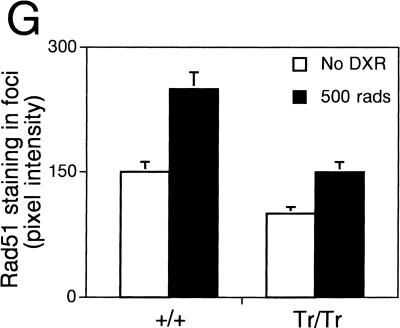
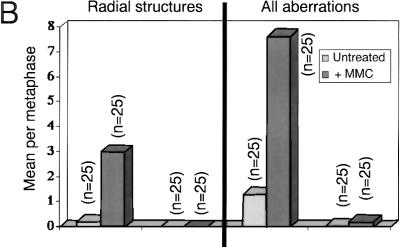
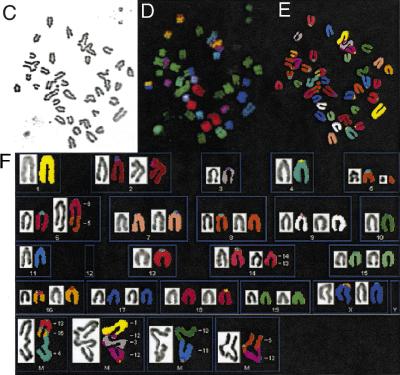
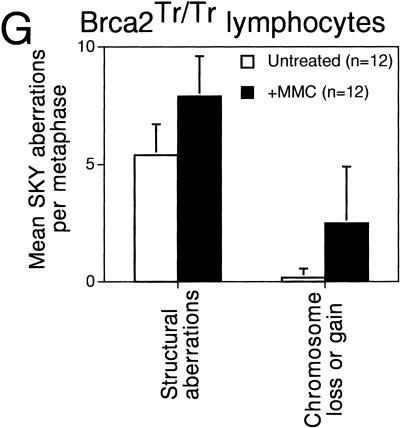
Cancer-causing mutations often arise from gross chromosomal rearrangements (GCRs) such as translocations, which involve genetic exchange between nonhomologous chromosomes. Here we show that murine Brca2 has an essential function in suppressing GCR formation after chromosome breakage. Cells that harbor truncated Brca2 spontaneously incur GCRs and genomic DNA breaks during division. They exhibit hypersensitivity to DNA damage by interstrand cross-linkers, which even at low doses trigger aberrant genetic exchange between nonhomologous chromosomes. Therefore, genetic instability in Brca2-deficient cells results from the mutagenic processing of spontaneous or induced DNA damage into gross chromosomal rearrangements, providing a mechanistic basis for cancer predisposition.


Figures

Figure 1
Figure 1
Genomic DNA breakage in dividing Brca2Tr/Tr cells without increased apoptosis. (A) PFGE analysis of high-molecular-weight DNA from cultures of Brca2+/+ or Brca2Tr/Tr cells. Arrows mark the entry of broken DNA into the gel. (B) The mean luminosity of staining (±s.d.) in the gel track excluding the origin is plotted in arbitrary units. (C) Staining with Annexin V, an early marker of apoptosis, is plotted on the x-axis, against propidium iodide incorporation (a late marker), on the y. The total percentage of apoptotic cells (boxed) is shown. To avoid bias, forward/side scatter gates were not applied, but as a result some cell debris is included in the box. (D) Incorporation of fluorescent (f-) dUTP into strand breaks is plotted logarithmically on the x-axis, against relative cell number, on the y. The dotted histograms in each panel represent the background staining with f-dUTP without TdT addition. The median fluorescence intensity (MFI) of f-dUTP incorporation is indicated.
Figure 2
Figure 2
SKY showing analysis of spontaneous chromosome abnormalities in Brca2Tr/Tr cells. (A) Shows a DAPI-banded image of a typical metaphase, after hybridization with fluorescent probes in B, and in display colors by assignation of hybridization signals to specific spectral ranges (C,D). (D) Shows multiple abnormalities representing GCRs (see text)
Figure 3
Figure 3
Extracts from BRCA2-deficient CAPAN-1 cells support NHEJ. The radio-labeled monomeric plasmid DNA (3 kb, open arrow) is converted into 6- and 9- kb products (solid arrows) by end-joining in lanes 2,6, and 10. Pre-treatment with wortmannin (lanes 3,7,11) or anti-Xrcc4 (lanes 4,8,12) inhibits end-joining activity. Control extracts were prepared from a pancreatic adenocarcinoma (PaCa) or breast carcinoma (MCF7) cells wild-type for BRCA2.
Figure 4
Figure 4
Impaired Rad51 focus formation in Brca2Tr/Tr cells. (A–D) Show staining for Rad51 before (no DXR) and 6 hr after irradiation. (E) Shows staining with an irrelevant control antiserum.. Background levels of nuclear foci in untreated cells, as well as the foci formed after γ-radiation, are less numerous (F) and stain less intensely for Rad51 (G) in Brca2Tr/Tr cells when compared with controls.
Figure 4
Figure 4
Impaired Rad51 focus formation in Brca2Tr/Tr cells. (A–D) Show staining for Rad51 before (no DXR) and 6 hr after irradiation. (E) Shows staining with an irrelevant control antiserum.. Background levels of nuclear foci in untreated cells, as well as the foci formed after γ-radiation, are less numerous (F) and stain less intensely for Rad51 (G) in Brca2Tr/Tr cells when compared with controls.
Figure 5
Figure 5
Hypersensitivity of Brca2Tr/Tr cells to mitomycin C (MMC) triggers aberrant genetic exchange between nonhomologous chromosomes. (A) Cell growth measured by the MTT colorimetric assay is plotted on the x-axis as a percentage relative to the response of untreated cells. The range of variability in the response of individual cultures of Brca2Tr/Tr lymphocytes is demonstrated by the two curves shown. Results are representative of three independent experiments. (B) MMC exposure induces chromosome aberrations in Brca2Tr/Tr cells at a dose that is without a similar effect in controls. (n) The number of metaphases examined. (C–F) SKY analysis of a typical individual metaphase as described in Fig. 2. (F) Genetic exchange between multiple nonhomologous chromosomes in the aberrant structures in the lowermost panel. (G) GCRs and aneuploidy marked by chromosome loss or gain is significantly more frequent in Brca2Tr/Tr cells than in control cells treated with MMC.
Figure 5
Figure 5
Hypersensitivity of Brca2Tr/Tr cells to mitomycin C (MMC) triggers aberrant genetic exchange between nonhomologous chromosomes. (A) Cell growth measured by the MTT colorimetric assay is plotted on the x-axis as a percentage relative to the response of untreated cells. The range of variability in the response of individual cultures of Brca2Tr/Tr lymphocytes is demonstrated by the two curves shown. Results are representative of three independent experiments. (B) MMC exposure induces chromosome aberrations in Brca2Tr/Tr cells at a dose that is without a similar effect in controls. (n) The number of metaphases examined. (C–F) SKY analysis of a typical individual metaphase as described in Fig. 2. (F) Genetic exchange between multiple nonhomologous chromosomes in the aberrant structures in the lowermost panel. (G) GCRs and aneuploidy marked by chromosome loss or gain is significantly more frequent in Brca2Tr/Tr cells than in control cells treated with MMC.

Similar articles

Cited by

References

    1. Baumann P, West SC. DNA end-joining catalyzed by human cell-free extracts. Proc Natl Acad Sci. 1998;95:14066–14070. - PMC - PubMed
    1. Baumann P, Benson FE, West SC. Human Rad51 protein promotes ATP-dependent homologous pairing and strand transfer reactions in vitro. Cell. 1996;87:757–766. - PubMed
    1. Benson FE, Baumann P, West SC. Synergistic actions of Rad51 and Rad52 in recombination and DNA repair. Nature. 1998;391:401–404. - PubMed
    1. Brown DG, Sun XM, Cohen GM. Dexamethasone-induced apoptosis involves cleavage of DNA to large fragments prior to internucleosomal fragmentation. J Biol Chem. 1993;268:3037–3039. - PubMed
    1. Chen C, Kolodner RD. Gross chromosomal rearrangements in S. cerevisiae replication and recombination defective mutants. Nat Genet. 1999;23:81–85. - PubMed

Publication types

MeSH terms

LinkOut - more resources