

doi: 10.1073/pnas.120174297.
Stepping rotation of F1-ATPase visualized through angle-resolved single-fluorophore imaging
Affiliations
- PMID: 10840052
- PMCID: PMC16530
- DOI: 10.1073/pnas.120174297
Item in Clipboard
Stepping rotation of F1-ATPase visualized through angle-resolved single-fluorophore imaging
Proc Natl Acad Sci U S A.
.
Abstract
Orientation dependence of single-fluorophore intensity was exploited in order to videotape conformational changes in a protein machine in real time. The fluorophore Cy3 attached to the central subunit of F(1)-ATPase revealed that the subunit rotates in the molecule in discrete 120 degrees steps and that each step is driven by the hydrolysis of one ATP molecule. These results, unlike those from the previous study under a frictional load, show that the 120 degrees stepping is a genuine property of this molecular motor. The data also show that the rate of ATP binding is insensitive to the load exerted on the rotor subunit.
Figures
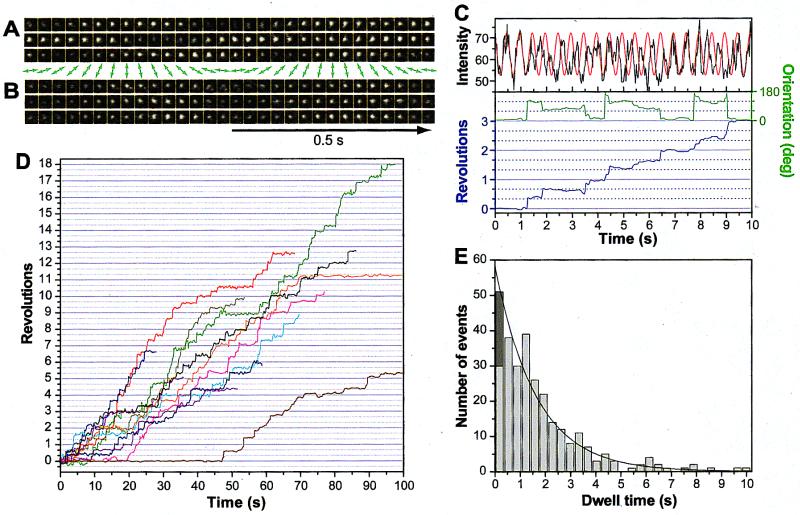
(A and B) Sequential fluorescence images, at 33-ms intervals, of single Cy3-F1 molecules at 20 nM ATP. The direction of excitation polarization is shown in green arrows. Each image was averaged spatially over 3 × 3 pixels (0.30 × 0.30 μm2); the size of images shown is 17 × 17 pixels. The excitation intensity was 1.1 mW over a sample area of 24 μm in diameter. (C) Time courses of the fluorescence intensity and calculated fluorophore angles. The black line shows the intensity at time t, I(t), of the spot in A integrated over a square of 0.79 × 0.79 μm2 enclosing the spot. When a fluorophore lies at an angle θ in the sample plane, its intensity is expected to flicker as cos2[360°⋅(t/T) − θ] ∝ cos[360°⋅(2t/T) − 2θ], where T (1 s) is the period of excitation rotation. Thus, θ(t) was determined by fitting the observed I(t) with this function over the period between t and t + T/2. The green curve shows θ(t) − θ0, where θ0 = θ(0); values between 0°and 180° were chosen. If this fluorophore had remained at θ0, I(t) would have flickered as in the red line which is proportional to cos2[360°⋅(t/T) − θ0] ∝ cos[360°⋅(2t/T) − 2θ0]. The accumulated rotation angle (blue line) was obtained by assuming that all steps were counterclockwise. (D) Time courses of the stepwise rotation of the γ-subunit at 20 nM ATP. Different lines show different fluorophores (F1). (E) Distribution of dwell times between steps. Each negative 120° step in the orientation records was interpreted as a zero dwell between two consecutive counterclockwise steps and counted as one in the dark part. The solid line shows the exponential fit. The average dwell time was 2.0 s.
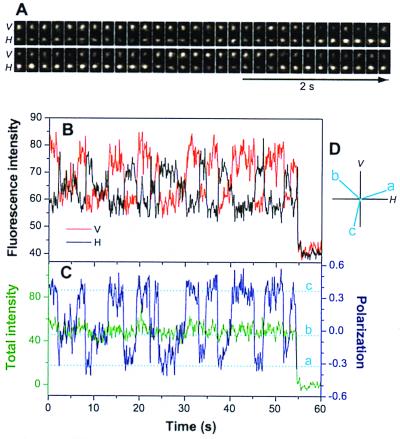
(A) Sequential fluorescence images, at 167-ms intervals, of a single Cy3-F1 molecule at 20 nM ATP. V, vertically polarized fluorescence; H, horizontally polarized fluorescence. Each image (15 × 30 pixels or 1.5 × 3.0 μm2) was averaged spatially over 3 × 3 pixels. (B) Time courses of spot intensities for V and H in A, median-filtered over eight video frames (0.27 s). (C) Time courses of the polarization, P = (V − H)/(V + H), and total intensity, I = V + H, calculated from B. The fluorophore photobleached at ≈55 s. Dashed lines (a, b, and c) are calculated P for the three orientations in D: P = 0.4 × [sin2(θ + 18°) − cos2(θ + 18°)], where θ = 0°, 120°, and 240°.
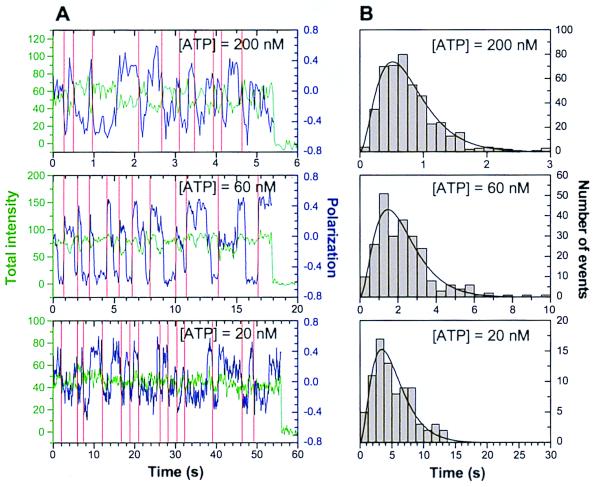
(A) Alternation of polarization at various ATP concentrations. The excitation intensity was 6.2 mW at 200 nM ATP, 3.2 mW at 60 nM ATP, and 1.8 mW at 20 nM ATP over a sample area of 24 μm in diameter (the frequency of alternation did not depend on excitation intensity). The polarizations at 60 and 20 nM ATP were calculated after V and H were median-filtered over four and eight video frames, respectively. Vertical red lines indicate termination of one revolution, identified by eye as the crossing of polarization through zero in a unique direction. All records were terminated by photobleaching. (B) Distribution of times for a turn at various ATP concentrations. The average values were 0.84 s at 200 nM ATP, 2.4 s at 60 nM ATP, and 5.5 s at 20 nM ATP. Solid lines show fits with the equation in the text.
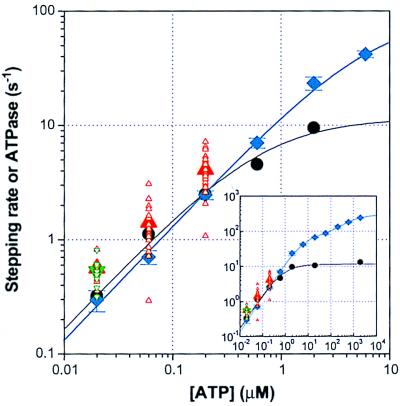
Comparison of stepping and ATP hydrolysis rates. Stepping rate (3× rotation rate) was determined for each spot as 1/<t> or 3/<3t>, where <t> and <3t> are average times per step (i, green triangles) or turn (ii, red triangles), respectively. Larger symbols show averages over spots. Black circles show previous estimates with actin (20). Hydrolysis rate V (blue diamonds with error bars showing SD) was estimated in solution (i.e., the rate shown is the ensemble average over all molecules in the solution) and was fitted with V = (kcataKmb[ATP] + kcatb[ATP]2)/([ATP]2 + Kmb[ATP] + KmaKmb), where kcata = 83 s−1, kcatb = 292 s−1, Kma = 6.3 μM, and Kmb = 680 μM. Hydrolysis rate of Cy3-labeled F1 (not shown) agreed within experimental error.
References
-
- Moerner W E. Science. 1997;277:1059–1060.
-
- Ishikawa M, Hirano K, Hayakawa T, Hosoi S, Brenner S. Jpn J Appl Phys. 1994;33:1571–1576.
-
- Funatsu T, Harada Y, Tokunaga M, Saito K, Yanagida T. Nature (London) 1995;374:555–559. - PubMed
Publication types
MeSH terms
Substances
LinkOut - more resources
Full Text Sources
