

doi: 10.1073/pnas.130181797.
True optical resolution beyond the Rayleigh limit achieved by standing wave illumination
Affiliations
- PMID: 10840057
- PMCID: PMC16528
- DOI: 10.1073/pnas.130181797
Item in Clipboard
True optical resolution beyond the Rayleigh limit achieved by standing wave illumination
Proc Natl Acad Sci U S A.
.
Abstract
During the last decade, various efforts have been undertaken to enhance the resolution of optical microscopes, mostly because of their importance in biological sciences. Herein, we describe a method to increase the resolution of fluorescence microscopy by illuminating the specimen with a mesh-like interference pattern of a laser source and electronic postprocessing of the images. We achieve 100-nm optical resolution, an improvement by a factor of more than 2 compared with standard fluorescence microscopy and of 1.5 compared with confocal scanning.
Figures
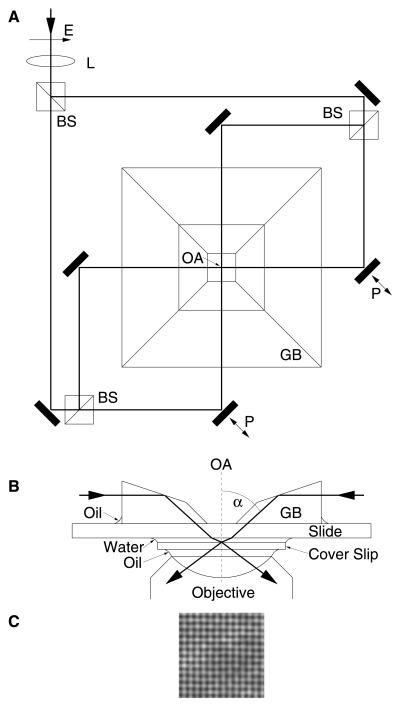
Interference-generating apparatus (A and B) and measured intensity distribution (C). (A) Top view. A collimated laser beam (λ = 488 nm) with a diameter of 1.5 mm is slightly focused by a weak lens (L; focal length 300 mm) before being split by beam splitters (BS) into four beams of equal intensity that cross at the optical axis (OA) of the microscope. The position of L is adjusted for a beam diameter of about 120 μm in the object plane. With this configuration, the curvature of the wavefronts is negligible in the small field of view (about 25 μm × 25 μm). Piezo actuated mirrors (P) are used to vary the path length for two beams. E, electrical polarization. (B) Cut view through the optical axis. The four laser beams (only two are shown) are coupled to the object by a glass block (GB) which is oil-immersed to the slide. A standard fluorescence filter cube (not shown; emission, bandpass 515–565 nm; beam splitter, dichroic long-pass 510 nm) turned out to be sufficiently selective to avoid problems linked to residual laser light on the CCD chip even though the intensity of the captured laser light was several orders of magnitude higher than that of the fluorescence light. (C) The interference pattern recorded with the fluorescence filter removed from the imaging path of the microscope. An additional neutral density filter with an attenuation rate of 10−3 is used to protect the eyes as well as the camera against the high intensities of the direct laser light. The nodal spacing is about 200 nm.
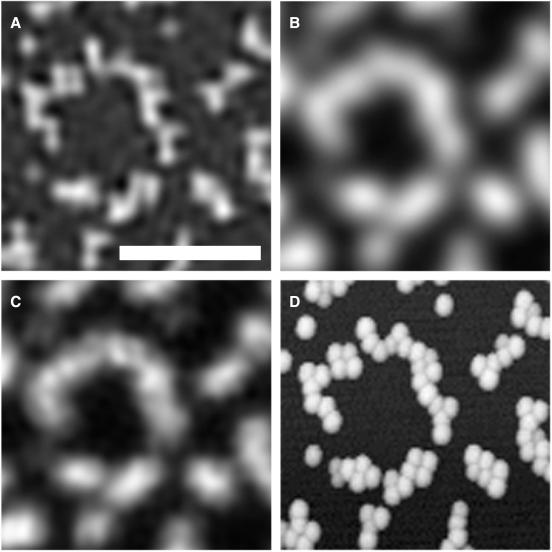
Identical area of a sample of 100-nm-diameter fluorescent polystyrene beads imaged with different techniques. (Bar = 1 μm.) (A) This panel was imaged by using HELM on a Zeiss Axiovert microscope with a Plan Apo ×63 1.4 NA objective. (B) This panel was imaged through identical lenses with standard illumination. The confocal image (C) was recorded on a Leica (Deerfield, IL) NTSP with a Leica Plan Apo ×100 1.4 NA objective. (D) This panel was recorded with an atomic force microscope (TopoMetrix Accurex II MS, Santa Clara, CA). The time-integrated laser power for the full field of view (25 μm × 25 μm) was about 30 mW for the confocal image and about 0.16 mW total for the five images required for HELM; the acquisition time was 6.5 s and 1.6 s, respectively. To stabilize the structures, we linked the carboxylate-modified surface of the beads (Fluoresbrite YG carboxylate microspheres, Polysciences) to the coverslip with polylysine (poly-l -lysine hydrobromide; molecular mass = 36 kDa; Sigma). The pixel distance of the CCD chip complied with the Shannon criterion; the quasicontinuous images presented herein were generated by band-limited interpolation. This interpolation procedure smoothes the pixel noise of the original images and is the reason for the granular structure of image (C).
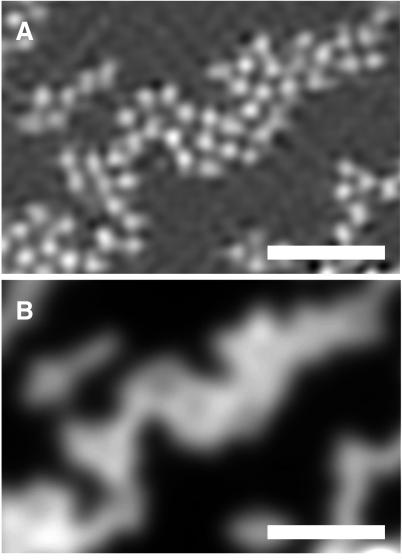
Fluorescent beads with a diameter of 200 nm imaged with HELM (A) and standard fluorescence microscopy (B). (Bar = 1 μm.) The microscope system as well as the specimen preparation are identical to those described for Fig. 2. The center distance of the tightly packed beads approximates the Rayleigh limit of 240 nm. The almost invisible contrast dip between the individual beads in B is a consequence of the fact that the beads are not point sources. Furthermore, one has to take into account that, for water-immersed beads, the effective NA of the objective (nominal: 1.4) becomes smaller (28).
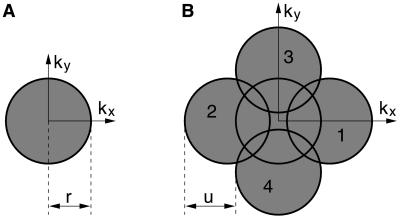
The enhancement of the support of the OTF by means of standing wave excitation. (A) The circular passband for standard fluorescence microscopy with cutoff frequency r. (B) The cloverleaf-shaped OTF of HELM. The four circular regions 1, 2, 3, and 4 are relocated copies of the circular passband from A and correspond to the components B+, B−, C+, and C− from Eq. 5, respectively. The displacement u is equal to the spatial frequency of the harmonic excitation. The ratio of u to r displayed in this figure corresponds to the real situation, because the cutoff frequency of the overall system is ≈20% less than that one expected from the nominal NA of our objective.
References
-
- Born M, Wolf E. Principles of Optics. New York: Pergamon; 1980.
-
- Sheppard C J R, Choudhury A. Acta Opt. 1977;24:1051–1073.
-
- Brakenhoff G J, Blom P, Barends P. J Microsc. 1979;117:219–232.
-
- Stelzer E H K. J Microsc. 1997;189:15–24.
-
- Sandison D R, Piston D W, Williams R M, Webb W W. Appl Opt. 1995;34:3576–3588. - PubMed
Publication types
MeSH terms
LinkOut - more resources
Full Text Sources
Other Literature Sources
Molecular Biology Databases
