. 2000 Jun 6;97(12):6509-14.
doi: 10.1073/pnas.97.12.6509.

Investigation of routes and funnels in protein folding by free energy functional methods

Affiliations

Investigation of routes and funnels in protein folding by free energy functional methods

S S Plotkin et al. Proc Natl Acad Sci U S A. .

Abstract

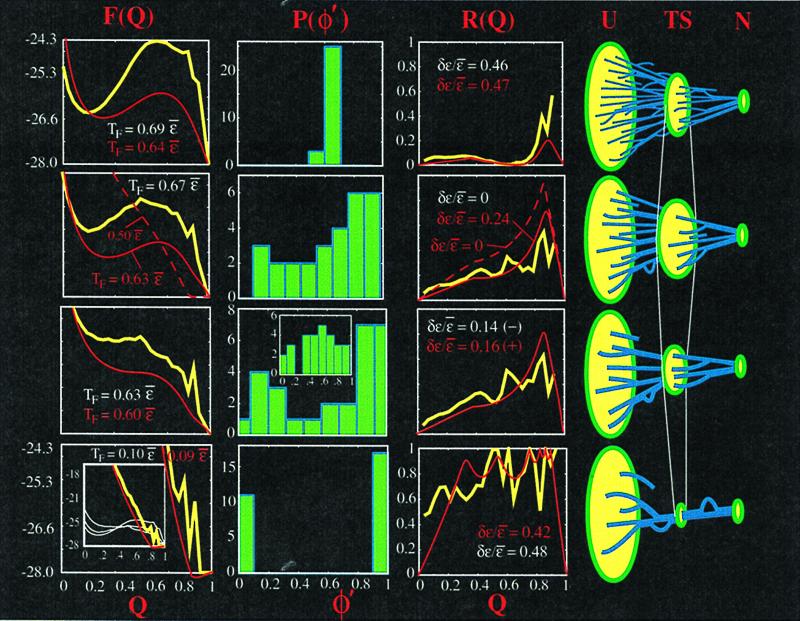
We use a free energy functional theory to elucidate general properties of heterogeneously ordering, fast folding proteins, and we test our conclusions with lattice simulations. We find that both structural and energetic heterogeneity can lower the free energy barrier to folding. Correlating stronger contact energies with entropically likely contacts of a given native structure lowers the barrier, and anticorrelating the energies has the reverse effect. Designing in relatively mild energetic heterogeneity can eliminate the barrier completely at the transition temperature. Sequences with native energies tuned to fold uniformly, as well as sequences tuned to fold reliably by a single or a few routes, are rare. Sequences with weak native energetic heterogeneity are more common; their folding kinetics is more strongly determined by properties of the native structure. Sequences with different distributions of stability throughout the protein may still be good folders to the same structure. A measure of folding route narrowness is introduced that correlates with rate and that can give information about the intrinsic biases in ordering arising from native topology. This theoretical framework allows us to investigate systematically the coupled effects of energy and topology in protein folding and to interpret recent experiments that investigate these effects.


Figures

Figure 1
Figure 1
The effects of heterogeneity in contact probability (increased, Top to Bottom) on barrier height F, folding temperature TF, and ordering heterogeneity are summarized here; plots are for simulations of a 27-mer lattice Gō model (yellow) to the same native structure (given in ref. 21), and for the analytic theory in the text (red). The simulation results make no assumptions as to the nature of the configurational entropy; the theoretical results use the approximate state function of Eq. 3, along with a cutoff used for the shorter loops so the bond entropy loss for each loop is always ≤0 (the same loop length distribution is used as in the lattice structure. In the top row, energies are tuned for both simulation and theory to fully symmetrize the funnel: Qii) = Q; second row: energies are then relaxed for the simulation results so they are all equal: ɛi = ɛ̄; energies in the theory are relaxed the same way until a comparable TF is achieved; third row: energies are then further tuned to a distribution ɛi ≅ ɛio that kills the barrier (there are many such distributions; all that is necessary is sufficient contact heterogeneity). The top three rows are funneled folding mechanisms with many routes to the native structure. Bottom row: energies are tuned to induce a single or a few specific routes for folding. All the while, the energies are constrained to sum to EN: Σiɛi = EN. The free energy profile F(Q) (in units of ɛ̄) is plotted in the left column at the folding transition temperature TF, which is given. The next column shows the distribution of thermodynamic contact probabilities Qi(Q) ≡ φ′ at the barrier peak [we use the notation φ′, because this is a thermodynamic rather than kinetic measurement; however, for well-designed proteins, the two are strongly correlated with coefficient ≈0.85 (42)]. Only simulation results are shown to keep the figure easy to read; the theory gives φ′ distributions within ∼10%, as may be inferred from their similar route measures. The next column shows the route measure ℛ(Q) of Eq. 5 and gives the dispersion in native energies required to induce the scenario of that row [ℛ(0, 1) = 0/0 is undefined and so is omitted from the simulation plots; it is defined in the theory through the limits Q → 0,1]. The right column shows schematically the different folding routes as heterogeneity is increased; from a maximum number of routes through Q to essentially just one route. Top row: In the uniformly ordering funnel, we can see first that P(φ′) is a δ function, and ℛ(Q) = 0 (cf. Eq. 5), so ordering at the transition state (or barrier peak Q) is essentially homogeneous. The number of routes through the bottleneck (cf. Eq. 2) is maximized, as schematically drawn (Right). Branches are drawn in the routes to illustrate the minimum of ℛ(Q) at Q. The free energy barrier is maximized (Eq. 10), thus the stability of the native state at fixed temperature and native energy is maximized, and so the folding temperature TF at fixed native energy is maximized. TF in the simulation is defined as the temperature where the native state (Q = 1) is occupied 50% of the time. In the theory, at TF the probability for Q ≥ 0.8 is 0.5. A very large dispersion in energies is required to induce this scenario. Some contact energies are nearly zero; others are several times stronger than the average. Second row: In the uniform native energy funnel, the barrier height is roughly halved while hardly changing TF for the following reason. In a Gō model, as the contact energies are relaxed from {ɛi} to a uniform value ɛi = ɛ̄, the energy of the transition state is essentially constant: initially the energy is ΣiQi(Qi = Q Σi ɛi = QEN and as the contact energies are relaxed to a uniform value ΣiQiɛ̄ = ɛ̄ΣiQi = QEN once again. However, the transition-state entropy increases and obtains its maximal value when ɛi = ɛ̄, because then all microstates at Q are equally probable, because the probability of occupying a microstate is pi ∼ exp(−Ei(Q)/T) = exp(−QEN/T)/Z = 1/Ω(Q). The thermal entropy −Σipilogpi then equals the configurational entropy log Ω(Q) (its largest possible value). Thus, as contact energies are relaxed from ɛi where they are anticorrelated to their loop lengths (more negative energies tend to be required for longer loops to have equal free energies) to ɛ̄ where they are uncorrelated to their loop lengths, the barrier initially decreases because the total entropy of the bottleneck increases (drawn schematically on the right); i.e., increases in polymer halo entropy are more important than decreases in route entropy. The system is still sufficiently two state that TF is hardly changed. P(φ′) is broad, indicating inhomogeneity in the transition state, solely in this scenario because of the topology of the native structure: all contacts are equivalent energetically. Routing is more pronounced when ɛi = ɛ̄, ℛ(Q) is a measure of the intrinsic fluctuations in order because of the natural inhomogeneity present in the native structure. Different structures will have different profiles, and it will be interesting to see how this measure of structure couples with thermodynamics and kinetics of folding. Loops and dead ends in the schematic drawings are used to illustrate local decreases and increases in ℛ(Q); these fluctuations are captured by the theory only when the routing becomes pronounced (bottom row). The solid curves presented for the theory are shown for a reduction in TF comparable to the simulations. There is still some energetic heterogeneity present, as indicated. When ɛi = ɛ̄ in the theory (dashed curves), the fluctuations in Qi are somewhat larger than the simulation values, and the entropic heterogeneity is sufficient to kill the barrier—the free energy is downhill at TF ≅ 0.5ɛ̄. The free energy barrier results from a cancellation of large terms and is significantly more sensitive than intensive parameters such as route measure ℛ(Q). Third row: In approaching the zero-barrier funnel scenario for the simulation, the energies are further perturbed and now begin to anticorrelate with contact probability (and tend to correlate with loop length); i.e., more probable contacts (which tend to have shorter loops) have stronger energies. For the theory, not as much heterogeneity is required. Contact energies are still correlated with formation probability, as indicated by the signs in parentheses. The free energy barrier continues to decrease until some set of energies {ɛio}, where the barrier at TF vanishes entirely. All the while, the transition temperature TF decreases only ∼10%, so that slowing of dynamics (as TF approaches TG) would not be a major factor. At this point, the φ′ distribution at the barrier position Q(ɛ̄) is essentially bimodal, but the distribution at Q({ɛio}) (Inset) is less so because of transition state drift towards lower Q values (the Hammond effect). A relatively small amount of energetic heterogeneity is needed to kill the barrier at TF. There are still many routes to the native state, because ℛ(Q) ≈ 0.3 − 0.4, but some contacts are fully formed in the transition state (some φ′ ≅ 1). Bottom row: As the energies continue to be perturbed to values that cause folding to occur by a single dominant route rather than a funnel mechanism, folding becomes strongly downhill at the transition temperature, which drops more sharply towards TG: to induce a single pathway here, TF must be decreased to about 1/4 the putative estimate of TG (about TF({ɛ̄})/1.6; see ref. 9). In this scenario, the actual shape of the free energy profile depends strongly on which route the system is tuned to; nonnative interactions not included here become important. Contact participation at the barrier is essentially one or zero, and the route measure at the barrier is essentially one. The entropy at the bottleneck is relatively small (the halo entropy of a single native core). The energetic heterogeneity necessary to achieve this scenario is again very large, comparable to what is needed to achieve a uniform funnel.

References

    1. Onuchic J N, Luthey-Schulten Z, Wolynes P G. Annu Rev Phys Chem. 1997;48:545–600. - PubMed
    1. Dill K A, Chan H S. Nat Struct Biol. 1997;4:10–19. - PubMed
    1. Veitshans T, Klimov D, Thirumalai D. Folding Des. 1997;2:1–22. - PubMed
    1. Gruebele M. Annu Rev Phys Chem. 1999;50:485–516. - PubMed
    1. Bryngelson J D, Wolynes P G. Proc Natl Acad Sci USA. 1987;84:7524–7528. - PMC - PubMed

Publication types

LinkOut - more resources