. 2000 Jun 15;20(12):4423-34.
doi: 10.1523/JNEUROSCI.20-12-04423.2000.

Prolonged synaptic currents and glutamate spillover at the parallel fiber to stellate cell synapse

Affiliations

Prolonged synaptic currents and glutamate spillover at the parallel fiber to stellate cell synapse

A G Carter et al. J Neurosci. .

Abstract

Although neurons often fire in bursts, most of what is known about glutamate signaling and postsynaptic receptor activation is based on experiments using single stimuli. Here we examine the activation of ionotropic glutamate receptors by bursts at the parallel fiber to stellate cell synapse. We show that brief stimulus trains generate prolonged AMPA receptor (AMPAR)- and NMDA receptor (NMDAR)-mediated EPSCs recorded in whole-cell voltage clamp. These EPSCs contrast with the rapid AMPAR-mediated EPSC evoked by a single stimulus. The prolonged AMPAR-mediated EPSC is promoted by high-frequency and high-intensity trains and can persist for hundreds of milliseconds. This EPSC is also increased by l-trans-2,4-PDC, an inhibitor of glutamate transporters, suggesting that these transporters usually limit the synaptic response to trains. These prolonged EPSCs reflect both receptor properties and a long-lasting glutamate signal. In addition, several experiments demonstrate that glutamate spillover can contribute to receptor activation. First, imaging stimulus-evoked changes in presynaptic calcium establishes that distinct parallel fiber bands can be activated. Second, activation of parallel fibers that do not directly synapse onto a given stellate cell can evoke indirect AMPAR- and NMDAR-mediated EPSCs in that cell. Third, experiments using the use-dependent NMDAR blocker MK-801 show that these indirect EPSCs reflect glutamate spillover in response to trains. Together, these findings indicate that stimulus trains can generate a sustained and widespread glutamate signal that can in turn evoke large and prolonged EPSCs mediated by ionotropic glutamate receptors. These synaptic properties may have important functional consequences for stellate cell firing.


Figures

Fig. 1.
Fig. 1.
Stellate cell EPSCs evoked by parallel fiber stimulation. Whole-cell voltage-clamp recordings from stellate cells in response to one (A) or five (B) pulses delivered to the parallel fibers at 100 Hz. Recordings were made at −60 mV in the absence of antagonists. Stimulus artifacts are blanked for clarity, and traces are single trial examples.
Fig. 2.
Fig. 2.
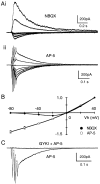
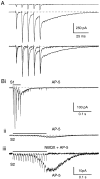
Pharmacology of the EPSCs. A, EPSCs evoked by five pulses at 100 Hz measured at holding potentials of −80, −60, −40, −20, 0, +20, and +40 mV. Recordings were made in the presence of either 10 μm NBQX (i) or 200 μm d-AP-5 (ii). B, Normalized peak EPSCs versus holding potential in the presence of NBQX (closed circles; n = 3) ord-AP-5 (open circles; n= 3). Peak EPSCs evoked at different holding potentials were normalized to those currents evoked at +40 mV. C, EPSCs evoked by five pulses at 100 Hz measured at −40 mV while in the presence of either 50 μmd-AP-5 or 30 μmGYKI 53655 plus 50 μmd-AP-5. Recordings inA–C are from different cells, and traces are averages of two to five trials.
Fig. 3.
Fig. 3.
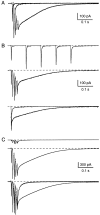
Stimulus conditions that elicit the prolonged AMPAR-mediated EPSC. A, EPSCs evoked by one, two, and five pulses at 100 Hz. B, EPSCs evoked by five pulses at 10 (top) or 100 (middle) Hz, and a scaled comparison of the time course of decay after the fifth stimulus (bottom). C, EPSCs evoked by five pulses at 100 Hz and either 3 (top) or 30 (middle) μA, and a comparison of the responses scaled to the last peak (bottom). Recordings were made at −40 mV, and 50 μmd-AP-5 was present for all experiments. Recordings in A–C are from different cells, and traces are averages of 10–40 trials.
Fig. 4.
Fig. 4.
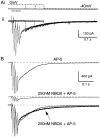
The prolonged AMPAR-mediated EPSC is not a consequence of poor voltage clamp. A, EPSCs evoked by five pulses at 100 Hz measured either at −40 mV or after stepping from 0 to −40 mV during the slow component of the EPSC, as shown in the schematic (i). After the step to −40 mV, the EPSCs are closely aligned (ii). The capacitative current has been subtracted. B, EPSCs evoked by five pulses at 100 Hz measured at −40 mV while in the presence of eitherd-AP-5 (top; bottom,thin line) or 250 nm NBQX plusd-AP-5 (middle; bottom,thick line), and a comparison of the responses scaled to the last peak (bottom). d-AP-5 (50 μm) was present for all experiments. Recordings inA and B are from different cells, and traces are averages of 6–40 trials.
Fig. 5.
Fig. 5.
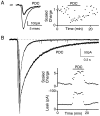
Inhibition of glutamate transporters enhances the prolonged AMPAR-mediated EPSC. EPSCs evoked by one (A) and five (B) pulses at 100 Hz while in the presence of either d-AP-5 (thin line) or 200 μm PDC plus d-AP-5 (thick line). Insets show the effect of PDC on the scaled synaptic charge transfer or leak current. Recordings were made at −40 mV, and 50 μmd-AP-5 was present for all experiments. Recordings in A andB are from different cells, and traces are averages of 10 trials.
Fig. 6.
Fig. 6.
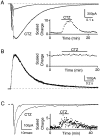
Reduction of AMPAR desensitization enhances the prolonged AMPAR-mediated EPSC. A, AMPAR EPSCs evoked by five pulses at 100 Hz measured at −40 mV while in the presence of either 50 μmd-AP-5 or 40 μmCTZ plus 50 μmd-AP-5. B, NMDAR EPSCs evoked by five pulses at 100 Hz while in the presence of either 10 μm NBQX or 40 μm CTZ plus 10 μm NBQX. C, AMPAR EPSCs evoked by one pulse measured at −40 mV while in the presence of either 50 μm D-AP-5 or 40 μm CTZ plus 50 μmd-AP-5. Insets show the effect of CTZ on the scaled synaptic charge transfer. Recordings inA–C are from different cells, and traces are averages of 4–10 trials.
Fig. 7.
Fig. 7.
Calcium imaging of parallel fiber bands.A, Schematic illustrating the load site, labeled fibers, location of stimulus electrodes S1 and S2, and field of view inB–F. B, Background fluorescence of fibers labeled with Oregon Green 488 BAPTA-1 AM. C,D, Fluorescence evoked by 100 pulses at 100 Hz for electrode S1 (C) or electrode S2 (D). E, F, Evoked changes in fluorescence for S1 (E) and S2 (F) in which B has been subtracted away from C and D, respectively. Traces are single trial examples.
Fig. 8.
Fig. 8.
AMPAR- and NMDAR-mediated EPSCs evoked by indirect pathway stimulation. A, Schematic illustrating direct (S1) and indirect (S2) pathways. B, AMPAR EPSCs evoked by stimulating a direct pathway with five pulses at 100 Hz (i) or an indirect pathway with 20 pulses at 100 Hz (ii, iii). Recordings were made at −40 mV, and 50 μmd-AP-5 was present. Addition of 10 μm NBQX blocked the indirect response (iii). C, AMPAR EPSCs evoked by five pulses at 100 Hz measured at −40 mV while in the presence of 50 μmd-AP-5 or 200 μm PDC plus 50 μmd-AP-5. D, NMDAR EPSCs evoked by stimulating a direct pathway with five pulses at 100 Hz (i) or an indirect pathway with 20 pulses at 100 Hz (ii, iii). Recordings were made at +40 mV, and 10 μm NBQX was present. Addition of 4 μm MK-801 blocked the indirect response (iii). The duration of stimulation is indicated by thehorizontal bars. Scale bar in Bi applies to Bi and Bii; scale bar inDi applies to Di and Dii. Recordings in B–D are from different cells, and traces are averages of four to five trials.
Fig. 9.
Fig. 9.
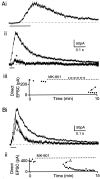
The indirect NMDAR-mediated EPSC is a consequence of glutamate spillover. Ai, Indirect NMDAR EPSC evoked by 20 pulses at 100 Hz. Aii, Direct NMDAR EPSCs evoked by five pulses at 100 Hz in control conditions (larger trace) and in MK-801 (smaller trace, *).Aiii, Peak direct NMDAR EPSCs as a function of time. After obtaining a stable recording (circles), 4 μm MK-801 was added to the bath (horizontal dashed line). The indirect pathway was stimulated at the indicated times (vertical lines), and then the direct response was tested. The first time the direct response was tested in MK-801 (*), the EPSC was greatly reduced in size. In B, the experiment was repeated, except now the indirect pathway was not stimulated in the presence of MK-801. Bi, Direct NMDAR EPSCs evoked by five pulses at 100 Hz in control conditions (larger trace) and in MK-801 (smaller trace, Δ). Bii, Peak direct NMDAR EPSCs as a function of time. The first time the direct response was tested in MK-801 (Δ), the EPSC was only slightly reduced in size. In all of the experiments, 10 μm NBQX was present, and the holding potential was stepped from −70 to +40 mV to assess the NMDAR EPSC. Recordings in A and B are from different cells.
Fig. 10.
Fig. 10.
Slow direct and indirect AMPAR-mediated EPSCs are present at 34°C. A, Direct AMPAR EPSCs evoked by five pulses at 100 Hz at low (top) or high (middle) stimulus intensity and a comparison of the responses scaled to the last peak (bottom).B, Direct AMPAR EPSCs evoked by five pulses at 100 Hz (S1) (i) and indirect AMPAR EPSCs evoked by 20 pulses at 100 Hz (S2) (ii). Addition of 10 μm NBQX blocked the indirect response (iii). Recordings were made at −40 mV, and 50 μmd-AP-5 was present for all experiments. Scale bar in Bi applies to Bi andBii. Recordings in A and Bare from different cells, and traces are averages of 5–20 trials.
Fig. 11.
Fig. 11.
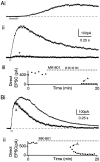
The indirect NMDAR-mediated EPSC at 34°C reflects glutamate spillover. These experiments were the same as those performed at 24°C (Fig. 9), except that now stimuli were separated by 15 sec, the MK-801 wash in time was 3 min, indirect pathway stimulation took place over a 3 min period, and the temperature was 34°C. Recordings in A and B are from different cells.
Fig. 12.
Fig. 12.
Response of stellate cells to parallel fiber stimulation. Cell-attached patch recordings (A) and whole-cell current-clamp recordings (B) from stellate cells in response to one (left) or five (right) pulses at 100 Hz using low- (i) or high- (ii) intensity stimulation. The high and low stimulus intensities differed by a factor of 2.5. Beneath each example in A andB is a raster plot showing spike timing for five consecutive trials. Below each raster plot is a markerindicating the time of stimulation. In B andC, the horizontal markers correspond to −65 and 0 mV. In C, the responses to five pulses at 100 Hz are replotted on an expanded time scale to better show the initial response to low- (C, left, corresponding to Bi, right) and high- (C, right, corresponding toBii, right) intensity stimulation. Recordings in A and B are from different cells, and traces are single trial examples.

References

    1. Asztely F, Erdemli G, Kullmann DM. Extrasynaptic glutamate spillover in the hippocampus: dependence on temperature and the role of active glutamate uptake. Neuron. 1997;18:281–293. - PubMed
    1. Atluri PP, Regehr WG. Determinants of the time course of facilitation at the granule cell to Purkinje cell synapse. J Neurosci. 1996;16:5661–5671. - PMC - PubMed
    1. Atluri PP, Regehr WG. Delayed release of neurotransmission from cerebellar granule cells. J Neurosci. 1998;18:8214–8227. - PMC - PubMed
    1. Bahn S, Volk B, Wisden W. Kainate receptor gene expression in the developing rat brain. J Neurosci. 1994;14:5525–5547. - PMC - PubMed
    1. Barbour B, Hausser M. Intersynaptic diffusion of neurotransmitter. Trends Neurosci. 1997;20:377–384. - PubMed

Publication types

MeSH terms

LinkOut - more resources