. 2000 Jun 15;20(12):4462-70.
doi: 10.1523/JNEUROSCI.20-12-04462.2000.

Functional architecture of synapses in the inner retina: segregation of visual signals by stratification of bipolar cell axon terminals

Affiliations

Functional architecture of synapses in the inner retina: segregation of visual signals by stratification of bipolar cell axon terminals

S M Wu et al. J Neurosci. .

Abstract

We correlated the morphology of salamander bipolar cells with characteristics of their light responses, recorded under voltage-clamp conditions. Twelve types of bipolar cells were identified, each displaying a unique morphology and level(s) of axon terminal stratification in the inner plexiform layer (IPL) and exhibiting light responses that differed with respect to polarity, kinetics, the relative strengths of rod and cone inputs, and characteristics of spontaneous EPSCs (sEPSCs) and IPSCs. In addition to the well known segregation of visual information into ON and OFF channels along the depth of the IPL, we found an overlying mapping of spectral information in this same dimension, with cone signals being transmitted predominantly to the central IPL and rod signals being sent predominantly to the margins of the IPL. The kinetics of bipolar cell responses correlated with this segregation of ON and OFF and of rod and cone information in the IPL. At light offset, rod-dominated cells displayed larger slow cationic current tails and smaller rapid overshoot responses than did cone-dominated cells. sEPSCs were generally absent in depolarizing bipolar cells but present in all hyperpolarizing bipolar cells (HBCs) and larger in rod-dominated HBCs than in cone-dominated HBCs. Inhibitory chloride currents, elicited both at light onset and light offset, tended to be larger for cone-dominated cells than for rod-dominated cells. This orderly segregation of visual signals along the depth of the IPL simplifies the integration of visual information in the retina, and it begins a chain of parallel processing in the visual system.


Figures

Fig. 1.
Fig. 1.
A, A fluorescence photograph of a bipolar cell in a retinal slice filled with Lucifer yellow.B, A sketch made while viewing the same cell at different focal planes. Depth within the IPL was characterized in inner plexiform layer units, with the INL margin corresponding to 0.0 IU and the ganglion cell margin to 1.0 IU.A, Axon; AT, axon terminal;C, cone; CB, cell body; D,dendrite; G, ganglion; GCL, ganglion cell layer; INL, inner nuclear layer;LC, Landolt club; OPL, outer plexiform layer; PRL, photoreceptor layer; R, rod;WAT, axon terminal field width;WD, dendritic field width.
Fig. 2.
Fig. 2.
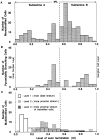
Frequency histograms for the levels of bipolar cell axon terminal ramification within the IPL. A, Cells with axon terminals ramifying in a single stratum (monostratified).B, Cells with pyramidally branching axon terminals.C, Cells with axon terminals ramifying in more than one strata (multistratified). Histograms were plotted against the level of axon terminal endings in inner plexiform layer units (defined in Fig.1B and Materials and Methods) with a bin width of 0.05 IU. On the basis of light responses (see Fig. 5) and dendritic glutamate responses (Maple and Wu, 1996), sublamina A is defined as 0.0–0.55 IU, and sublamina B is defined as 0.55–1.0 IU.
Fig. 3.
Fig. 3.
A, C, Scatter plots ofWD (defined in Fig.1B; A) andWAT (C) against the level of the axon terminal ramification in the IPL (in inner plexiform layer units). B, D, The mean (± SE)WD and WAT are shown in B and D, respectively.
Fig. 4.
Fig. 4.
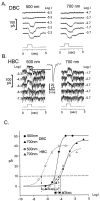
A, B, Current responses of a DBC (A) and an HBC (B) to 500 and 700 nm light steps of various intensities (labeled in log units of attenuation on the left of each currenttrace). C, The response–intensity relations for these current responses. For the criterion response of 10 pA marked by the horizontaldashedline, ΔS for the DBC is 0.81 and for the HBC is 2.60. Inset in B, One of the sEPSCs that contributed to the very noisy signals observed in this cell.
Fig. 5.
Fig. 5.
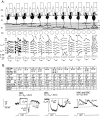
A, Morphology (sketches of Lucifer yellow-filled cells in retinal slices; top row) and light-evoked current responses (to a 500 nm stimulus of −1.3 log unit intensity; bottomrow) recorded under voltage-clamp conditions at various holding potentials. For all cells,EC = 0 mV andECl = −60 mV, and thus ΔIC and sEPSCs were measured at −60 mV, and ΔICl and sIPSCs were measured at 0 mV. Vertical calibration bar (bottomleft): 100 pA for type 1–11 bipolar cells; 200 pA for the type 12 bipolar cell. B, Top, Summary of the levels of axon terminal ramification in the IPL (in inner plexiform layer units), the average (± SE) values (N, number of cells averaged) of the relative spectral difference (ΔS) and the amplitude (in pA) and polarity (+, outward; −, inward) of the light-evoked excitatory current at light onset (ΔICON), the ratios of excitatory current response at light offset/onset (ΔICOFF/ΔICON) for off overshoot (OS) and tail (Tail) responses, the ratios of light-evoked inhibitory ON and OFF current response/excitatory ON current response (ΔIClON/ΔICON, ΔIClOFF/ΔICON), and the approximate frequency (0, absent; *, low; **, medium; and ***, high) of sEPSCs and sIPSCs for the 12 classes of bipolar cells.Bottom, Illustrations of how ΔICON, ΔICOFF(OS), ΔICOFF(Tail), ΔIClON, and ΔIClOFF of the HBC and the DBC were measured. For responses that had no cationic current tail of the same polarity as ΔICON, ΔICOFF(Tail) was assigned a value of zero. The values of ΔICOFF(OS), ΔICOFF(Tail), ΔIClON, and ΔIClOFF were normalized relative to the value of ΔICON before averaging.

References

    1. Ammermuller J, Kolb H. The organization of the turtle inner retina. I. ON- and OFF-center pathways. J Comp Neurol. 1995;358:1–34. - PubMed
    1. Ashmore JF, Copenhagen DR. Different postsynaptic events in two types of retinal bipolar cell. Nature. 1980;288:84–86. - PubMed
    1. Ashmore JF, Falk G. Photon-like signals following weak rhodopsin bleaches. Nature. 1981;289:489–491. - PubMed
    1. Boycott BB, Dowling JE. Organization of the primate retina: light microscopy. Philos Trans R Soc Lond B Biol Sci. 1969;255:109–194. - PubMed
    1. Boycott BB, Wassle H. Morphological classification of bipolar cells in the macaque monkey retina. Eur J Neurosci. 1991;361:1069–1088. - PubMed

Publication types

LinkOut - more resources