. 2000 Jun 15;20(12):4758-67.
doi: 10.1523/JNEUROSCI.20-12-04758.2000.

Local disparity not perceived depth is signaled by binocular neurons in cortical area V1 of the Macaque

Affiliations

Local disparity not perceived depth is signaled by binocular neurons in cortical area V1 of the Macaque

B G Cumming et al. J Neurosci. .

Abstract

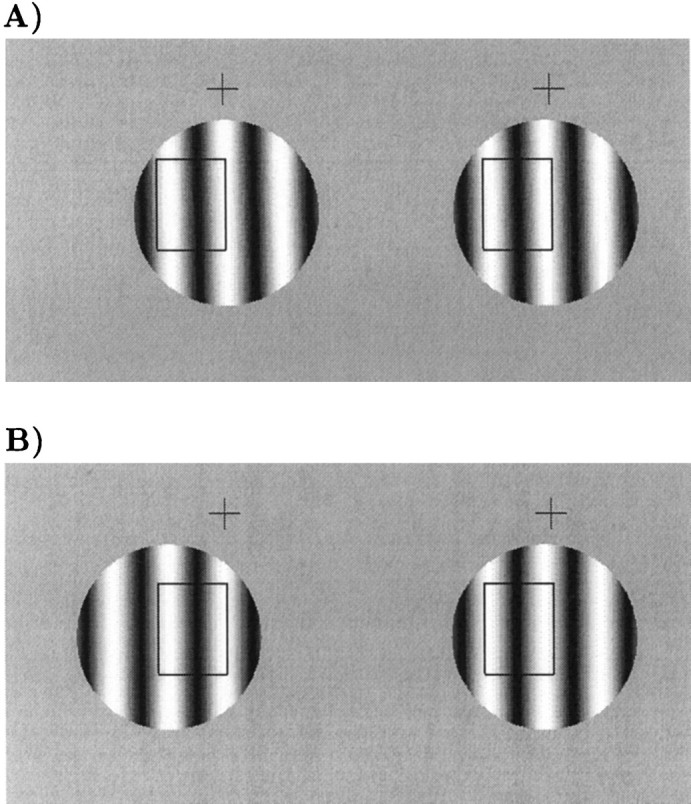
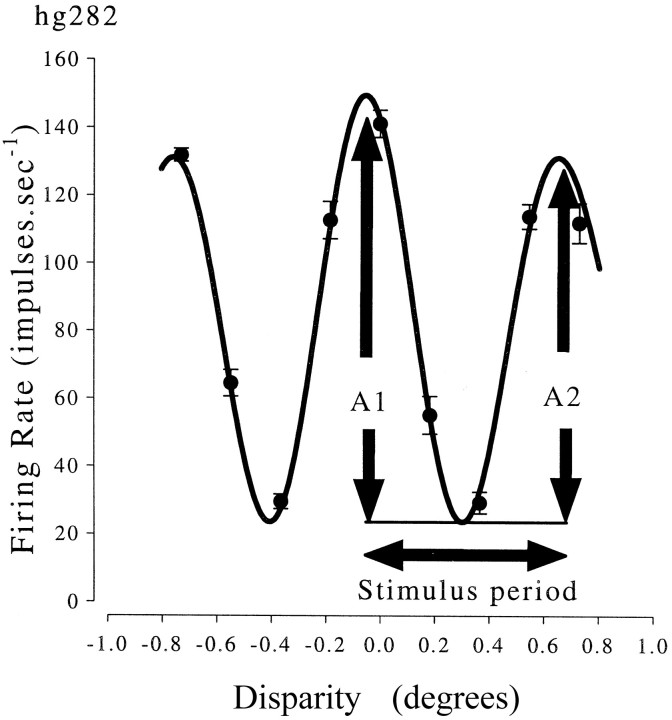
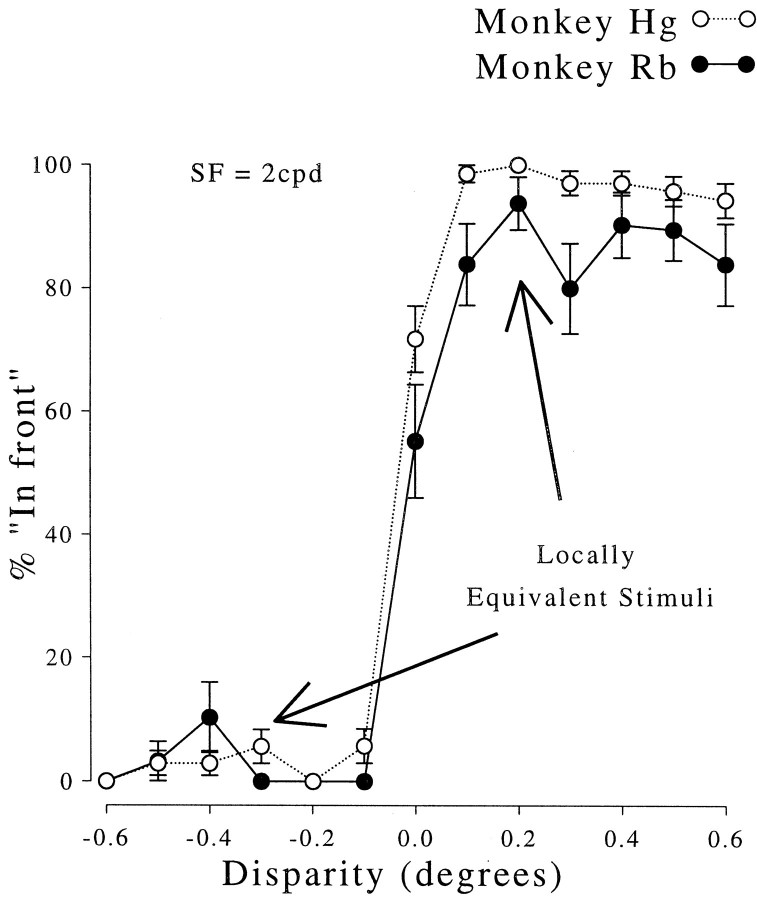
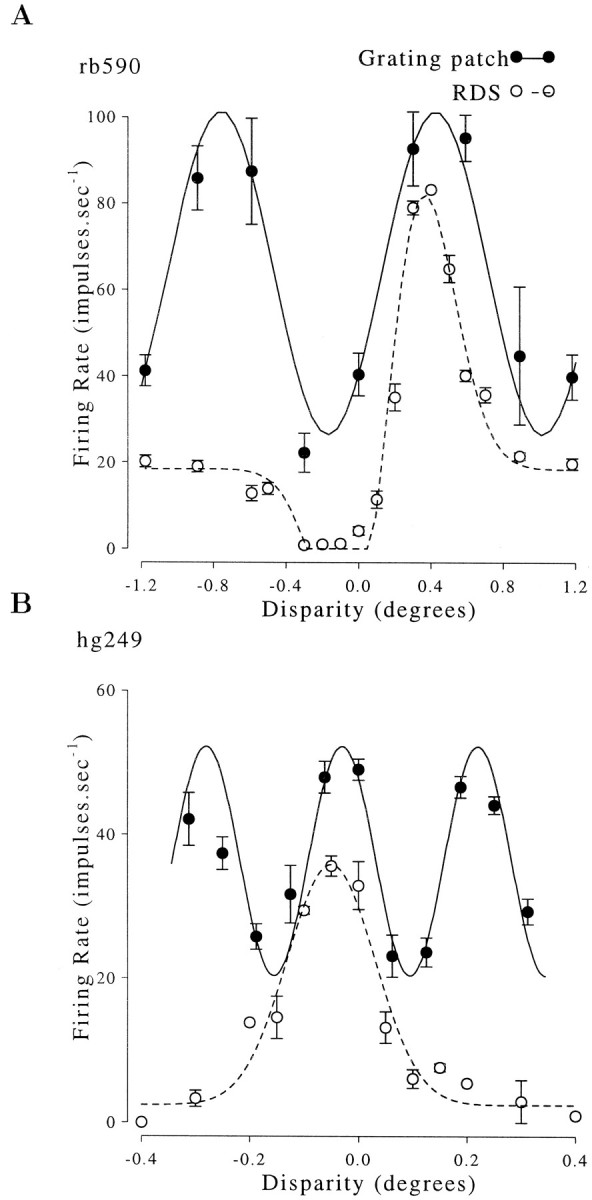
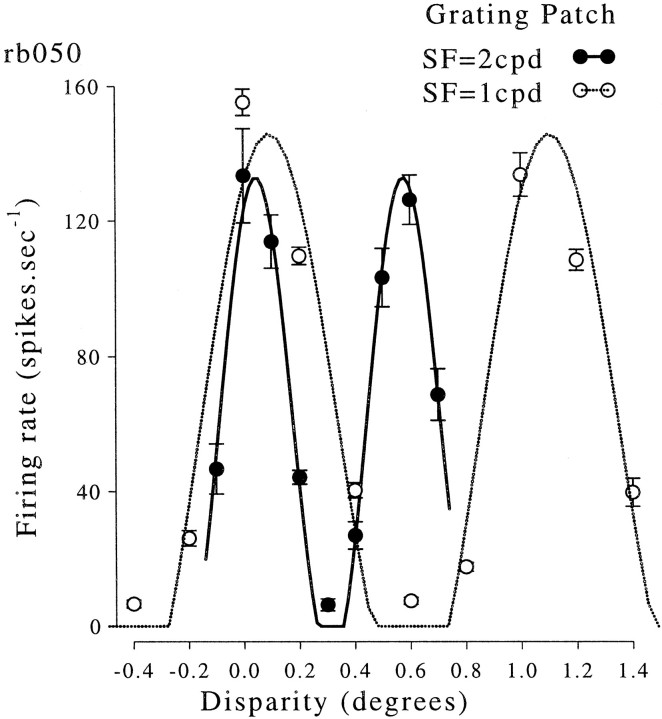
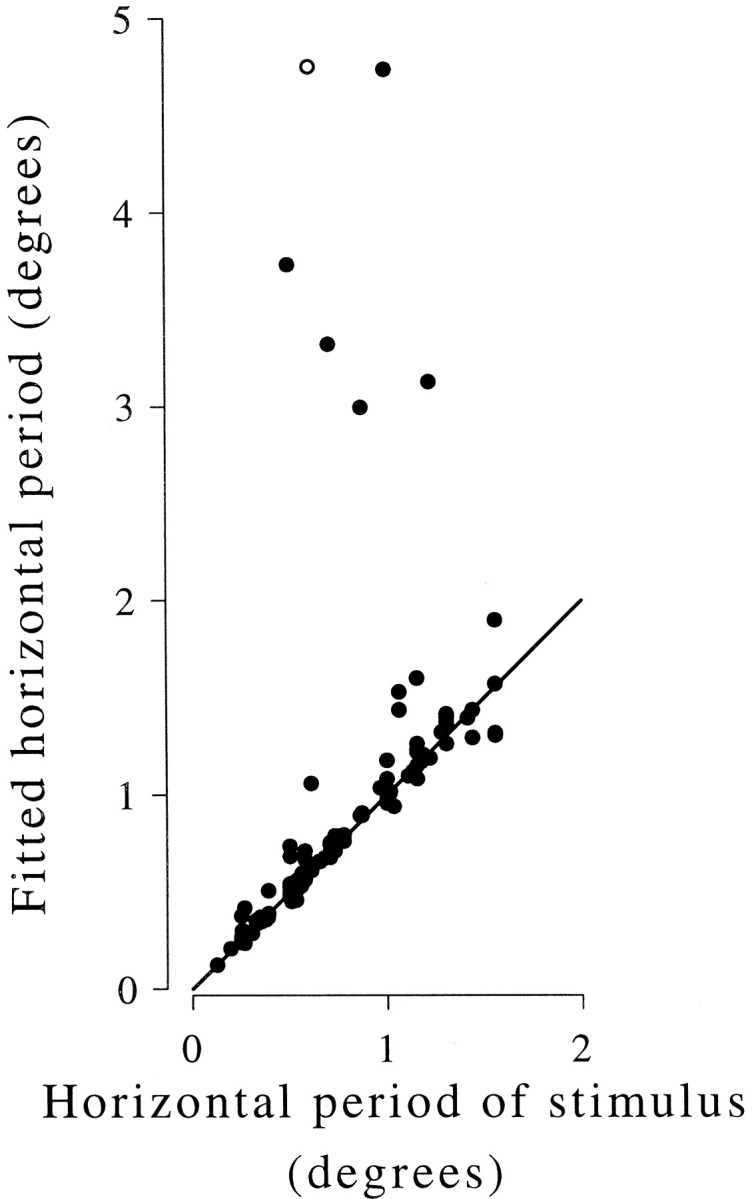
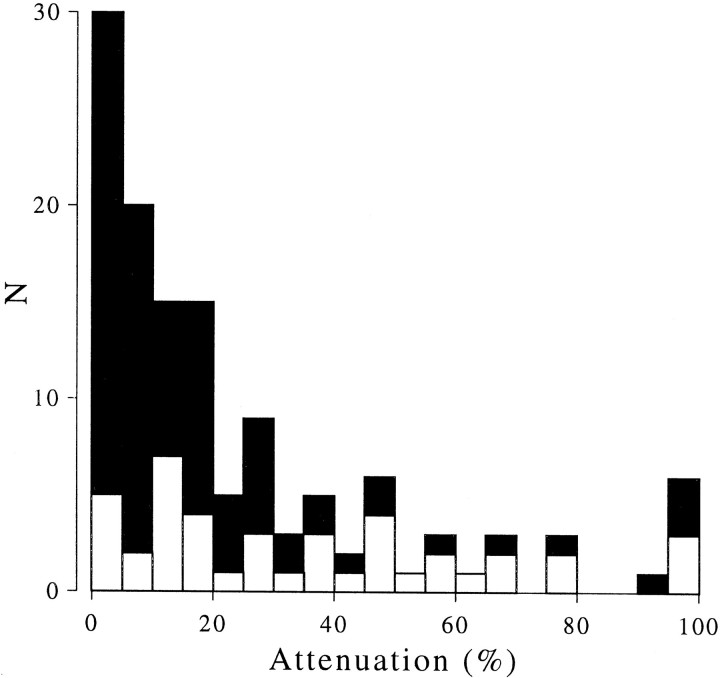
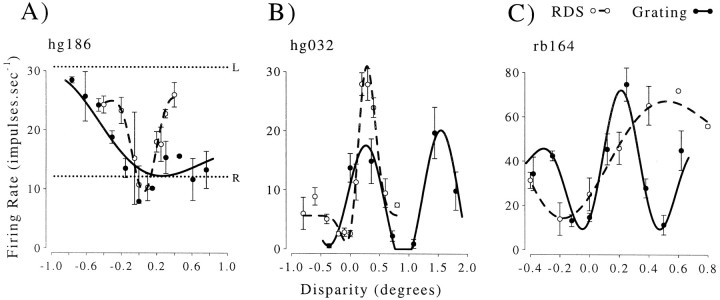
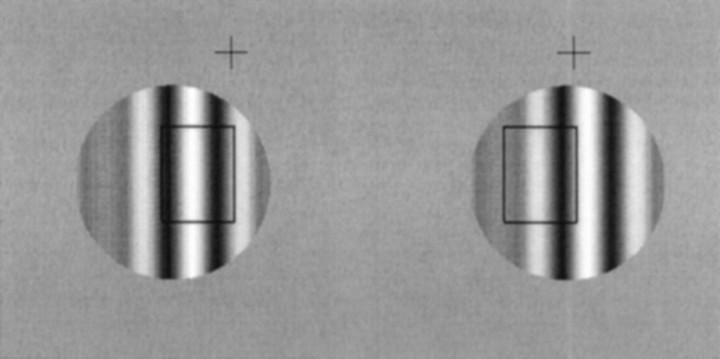
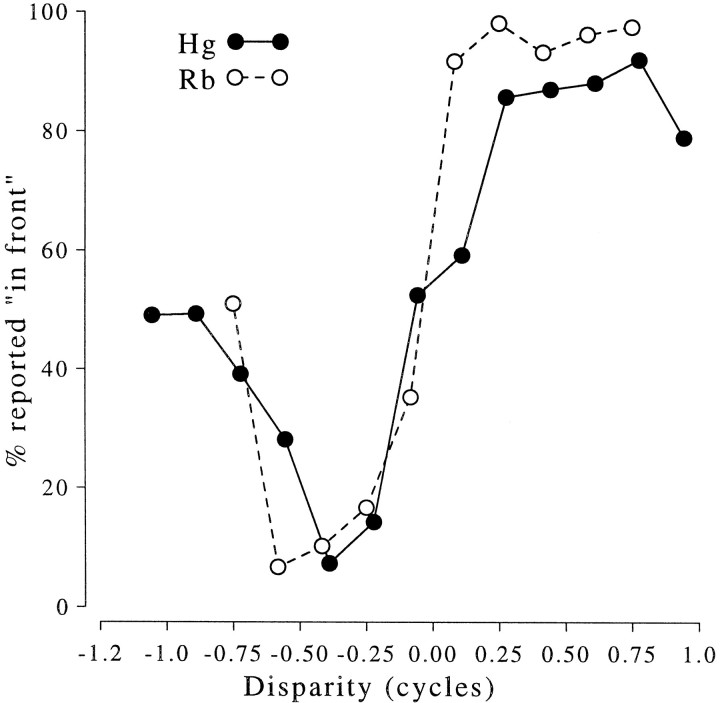
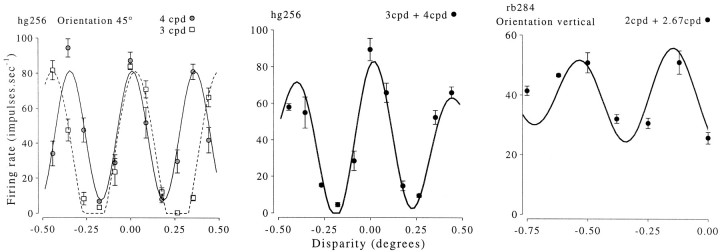
Binocular neurons that are closely related to depth perception should respond selectively for stimuli eliciting an appropriate depth sensation. To separate perceived depth from local disparity within the receptive field, sinusoidal luminance gratings were presented within a circular aperture. The disparity of the aperture was coupled to that of the grating, thereby rendering unambiguous the psychophysical matching between repeating cycles of the grating. In cases in which the stimulus disparity differs by one horizontal period of the grating, the portion of the grating that locally covers a receptive field is binocularly identical, but the depth sensation is very different because of the aperture. For 117 disparity-selective V1 neurons tested in two monkeys, the overwhelming majority responded equally well to configurations that were locally identical but led to different perceptions of depth. Because the psychophysical sensation is not reflected in the firing rate of V1 neurons, the signals that make stereo matches explicit are most likely elaborated in extrastriate cortex.


Figures

Fig. 1.
Fig. 1.
Example stimuli for free fusion. Therectangle shows diagrammatically the location of a putative receptive field. In A, corresponding parts of the stimulus overlie the receptive field. In B, the stimulus within the receptive field is identical to A, but noncorresponding parts of the stimulus are within the receptive field. Despite the fact that one of these stimuli is seen in front of the fixation cross and one is seen behind, the stimulus within the putative receptive field is the same. For clarity of exposition, the disparity is applied by translating only the left image in this diagram. During recording, disparity was applied with a symmetrical displacement of both monocular half images.
Fig. 2.
Fig. 2.
Disparity selectivity of one neuron and the corresponding Gabor fit. The Gabor fit is constrained to be even-symmetric (the Gaussian is always centered at the peak). This fit is then used to compare the magnitudes of responses to locally identical stimuli (differing in disparity by one period of a horizontal cross section through the stimulus). The stimulus here was a 4 cycles per degree (cpd) grating oriented 70° from vertical, so the horizontal period was 0.25/cos(70°) = 0.73°. The peak-to-trough amplitude at the preferred disparity (A1) is compared with the peak-to-trough amplitude for the response to a disparity differing by one stimulus period (A2). This is expressed in percent attenuation: 100 ∗ (A1 − A2)/A1, and in this example is 15%. Note that if the period of the fitted Gabor is different from the stimulus period, the second peak in the Gabor fit is not at the disparity one stimulus period away from the peak. A2 is then smaller than the amplitude of the second peak in the Gabor fit.
Fig. 3.
Fig. 3.
Psychophysical responses to gratings of the two monkeys used in this study. For all near (positive) disparities the animals consistently report seeing the grating patch in front of the fixation marker. Similarly, far disparities are consistently reported as behind. Error bars show SDs of the binomial distributions. Each stimulus was presented 50 times.
Fig. 4.
Fig. 4.
Responses of complex cells from each animal to both RDS and grating stimuli. The responses to random dot stimuli show one peak, whereas the responses to sinusoidal stimuli show two peaks. The responses to RDS are fitted with a Gabor function; the responses to gratings are fitted with a sinusoid. The spatial frequency of the sinusoid was free to vary, and the best fitting periods (1.21 and 0.263°) were very close to the respective horizontal periods of the stimuli (rb590: 4 cpd grating, oriented 78° away from vertical, horizontal period = 1.18°; Hg246: 4 cpd vertical grating, horizontal period = 0.25°). Error bars show SEM.
Fig. 5.
Fig. 5.
Responses of one complex cell to circular patches of sinusoidal grating at different disparities. The stimulus orientation was vertical, and data were collected for two spatial frequencies. Both disparity tuning curves show two peaks, and the separation of the peaks is approximately equal to the spatial period of the stimulus. The continuous lines show sinusoidal functions fitted to the data. The spatial frequency of the fitted sinusoid was free to vary, so the best fitting frequency gives a measure of how closely the separation of the peaks matches the predicted value.
Fig. 6.
Fig. 6.
Disparity modulation is sinusoidal with the spatial period predicted by local matching. The period of the best fitting sinusoid is plotted against the horizontal spatial period of the stimulus. Results of 129 experiments are plotted from 117 neurons. Responses were measured at two spatial frequencies in 12 neurons. Most neurons show a close agreement between the expected and observed spatial period (solid line). Small deviations above this line could be the result of vergence eye movements (see Results). The open symbol shows the most extreme deviation (hg186), for which the tuning curve is shown in Figure8.
Fig. 7.
Fig. 7.
Frequency distribution of response attenuation. This compares the response at the peak of the Gabor with the response to a stimulus differing in disparity by exactly one period of the stimulus. This is expressed as a percentage attenuation relative to the peak response. There is a large clustering of neurons in the region of zero attenuation. Note that attenuation is always calculated relative to the peak of the fitted Gabor, even though this peak could have occurred in response to a false match. Indeed comparison with the responses to RDS stimuli suggested that for many cells the largest peak was in response to a false match. Solid symbols show the data for strongly disparity-selective neurons (maximum response >20 spikes/sec and maximum response > twice minimum response). Open symbols show the remaining data.
Fig. 8.
Fig. 8.
Responses of three neurons illustrating extreme deviations from simple sinusoidal tuning functions. In all three cases, the attenuation is much larger than the median of the population (14%), so these represent extreme examples. Nonetheless, when the responses to RDS are considered, it is hard to reconcile any of these cases with a specific selectivity for global matches. In each case, thesolid line shows the Gabor fit to the disparity tuning measured with gratings (solid symbols), and the dashed line shows a Gabor function fit to the disparity tuning measured with RDS (open symbols). A, Most extreme deviation observed in the entire data set (100% attenuation). The repeat period of the grating tuning curve is much larger than the stimulus period (ratio 7.8, shown with an open symbol in Fig. 6). The pattern of disparity selectivity for gratings is quite different from that observed in response to RDS. Note that the response to large positive disparities is similar to that for right eye monocular stimulation (dashed line), as if the grating patch no longer covered the RF in the left eye. B, Example in which the tuning function shows the expected periodicity but shows changes in the depth of modulation (27% attenuation). Note that the greatest firing rate is in response to a false match (assuming that the response to RDS indicates the global match normally signaled by this neuron). C, Example in which responses on either side of the central peak are attenuated (43%), yet once again the value of the preferred disparity is different from that shown in response to RDS. The pattern seen in response to the grating could occur if the area of binocular overlap in the stimulus no longer covers the neuron's binocular summation area. In all three cases shown here, the comparison of responses to gratings and RDS does not support the view that these neurons fire selectively for global stereoscopic matches.
Fig. 9.
Fig. 9.
Example binocular compound grating. This is the sum of two gratings, with spatial frequencies in the ratio 3∶4. These were chosen to ensure that both component gratings produced disparity-selective responses in the neuron. The stimulus is shown here with a disparity equal to the spatial period of one of the component gratings. Thus, within the RF, one of the grating components is exactly aligned, but the other is not.
Fig. 10.
Fig. 10.
Psychophysical responses to compound gratings, for the two animals from which neurons were recorded. The stimulus was a vertical compound grating multiplied by a Gaussian with an SD of 3°. The two component gratings had spatial frequencies of 3 and 4 cpd for monkey Rb and 6 and 8 cpd for monkey Hg. The disparity is expressed in multiples of the period of the grating of lower spatial frequency. Both animals correctly discriminate stimuli at ±0.5 cycles of disparity, indicating that they combine information across the two spatial frequencies to solve the correspondence problem.
Fig. 11.
Fig. 11.
Effects of stimulating two disparity selective neurons with compound gratings. Left graph, Responses of one neuron to the two component gratings presented individually. The fitted curves are sinusoids in which the spatial period is fixed at the horizontal period of the stimulus. Center graph, Responses of the same cell to a stimulus that was the sum of the two stimuli in the left graph. The fitted curve shows a weighted linear sum of the two sinusoids fitted to the data in the left graphand accounts for 85% of the variance induced by disparity. Right graph, Responses to the compound grating of the cell for which the fitted curve was the worst in the data set. Despite this, the data are qualitatively similar to those in the center graph. There is a second peak in the tuning curve, which is smaller and broader than the peak near 0 disparity.

References

    1. Armitage P, Berry G. Statistical methods in medical research. Blackwell; Oxford: 1994.
    1. Britten KH, Shadlen MN, Newsome WT, Movshon JA. Responses of neurons in macaque MT to stochastic motion signals. Vis Neurosci. 1993;10:1157–1169. - PubMed
    1. Cogan A, Lomakin A, Rossi A. Depth in anticorrelated stereograms. Vision Res. 1993;33:1959–1975. - PubMed
    1. Cumming BG, Parker AJ. Responses of primary visual cortical neurons to binocular disparity without the perception of depth. Nature. 1997;389:280–283. - PubMed
    1. Cumming BG, Parker AJ. Binocular neurons in V1 of awake monkeys are selective for absolute, not relative, disparity. J Neurosci. 1999;19:5602–5618. - PMC - PubMed

Publication types

LinkOut - more resources