. 2000 Jul;20(13):4580-90.
doi: 10.1128/MCB.20.13.4580-4590.2000.

Involvement of p21(Waf1/Cip1) in protein kinase C alpha-induced cell cycle progression

Affiliations

Involvement of p21(Waf1/Cip1) in protein kinase C alpha-induced cell cycle progression

A Besson et al. Mol Cell Biol. 2000 Jul.

Abstract

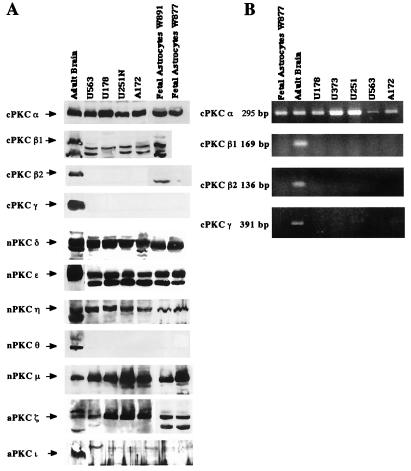
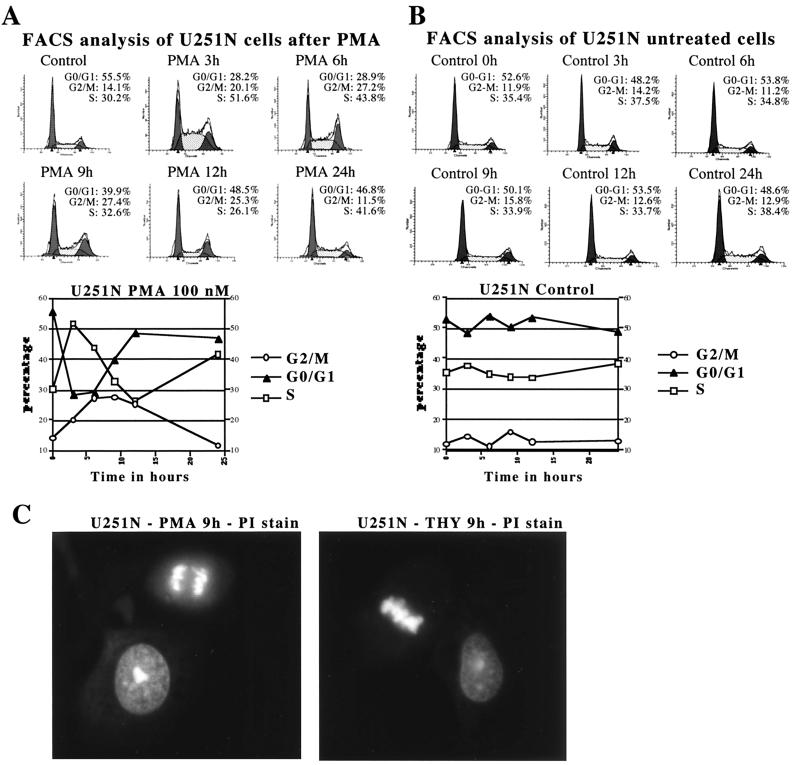
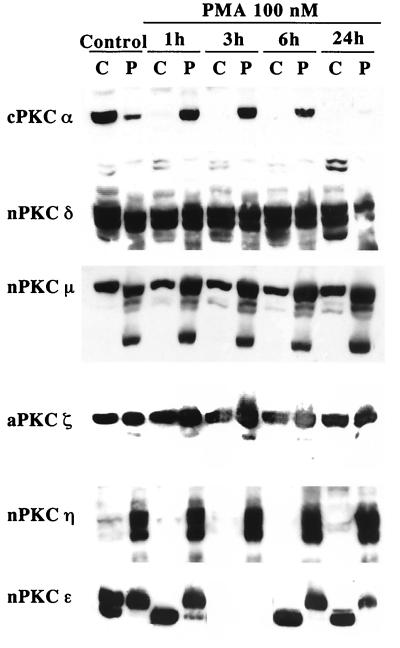
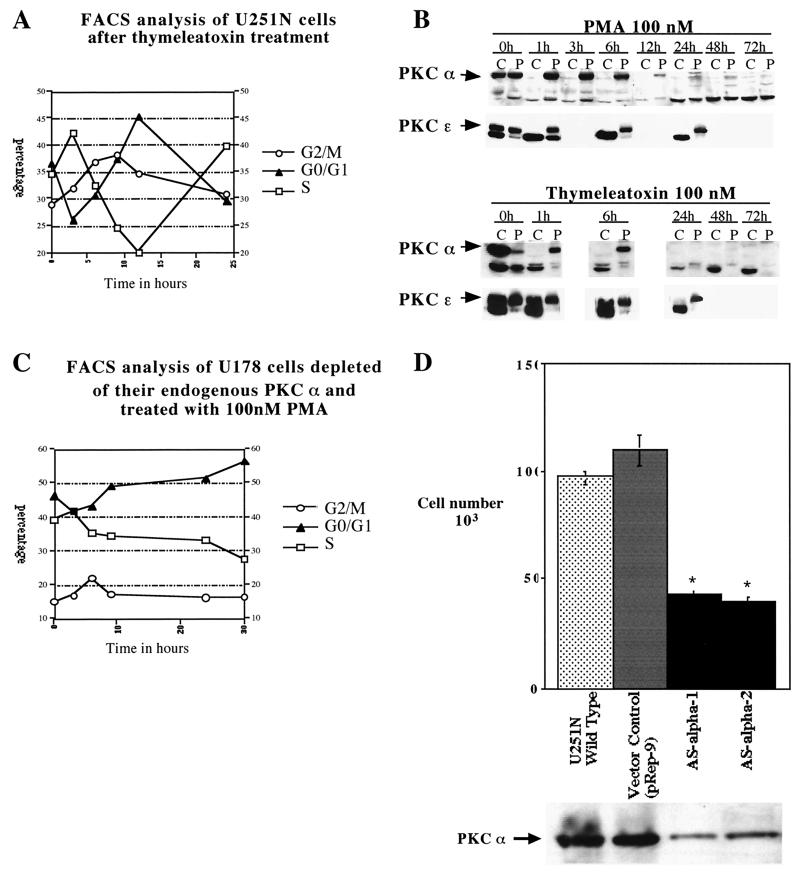
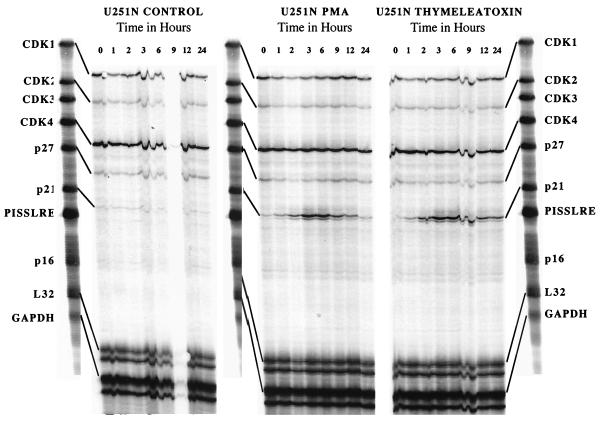
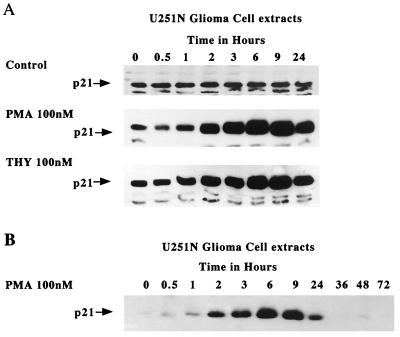
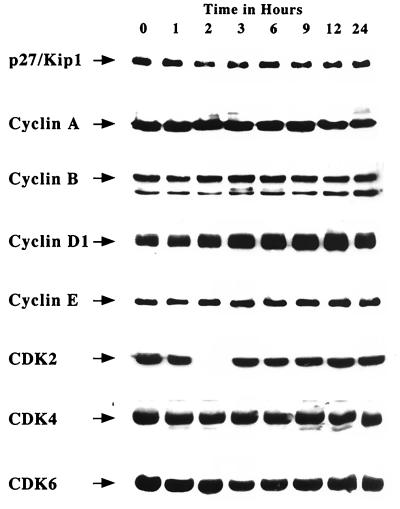
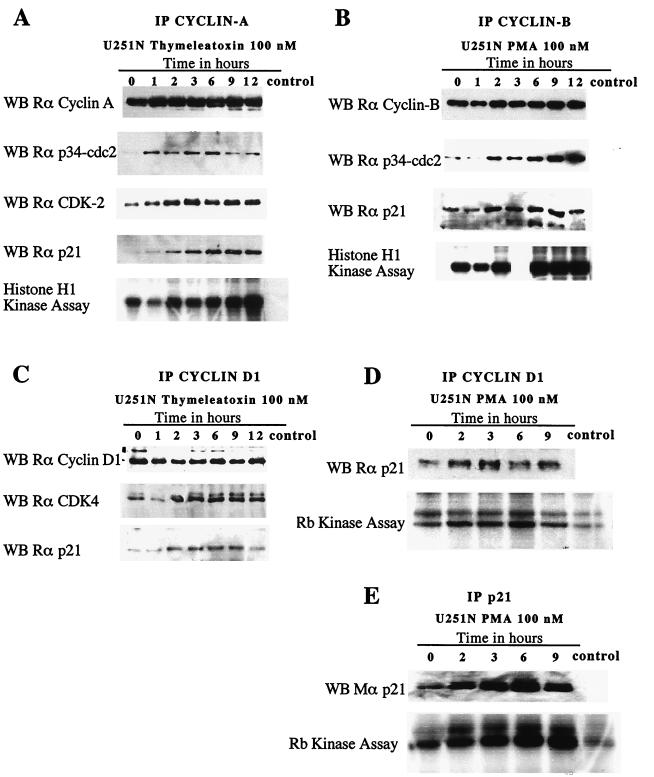
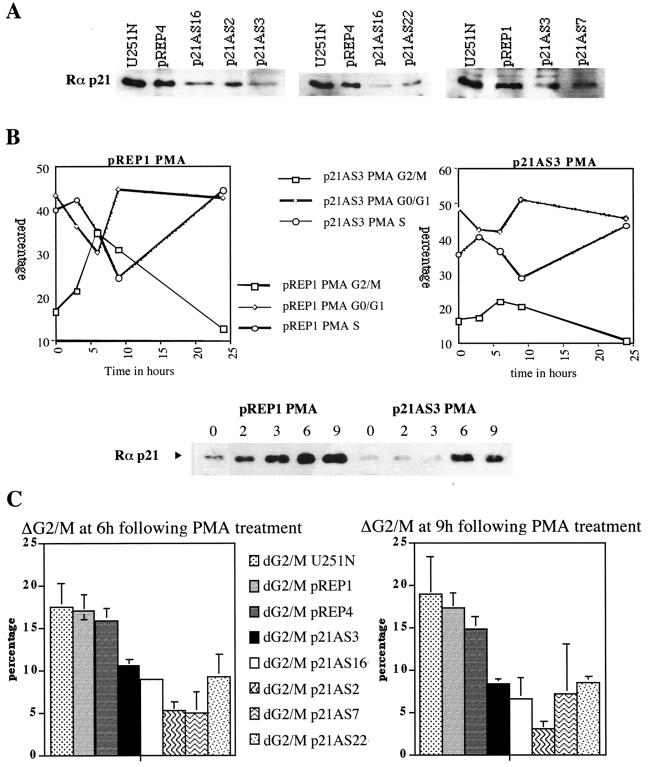
Protein kinase C (PKC) plays an important role in the regulation of glioma growth; however, the identity of the specific isoform and mechanism by which PKC fulfills this function remain unknown. In this study, we demonstrate that PKC activation in glioma cells increased their progression through the cell cycle. Of the six PKC isoforms that were present in glioma cells, PKC alpha was both necessary and sufficient to promote cell cycle progression when stimulated with phorbol 12-myristate 13-acetate. Also, decreased PKC alpha expression resulted in a marked decrease in cell proliferation. The only cell cycle-regulatory molecule whose expression was rapidly altered and increased by PKC alpha activity was the cyclin-cyclin-dependent kinase (CDK) inhibitor p21(Waf1/Cip1). Coimmunoprecipitation studies revealed that p21(Waf1/Cip1) upregulation was accompanied by an incorporation of p21(Waf1/Cip1) into various cyclin-CDK complexes and that the kinase activity of these complexes was increased, thus resulting in cell cycle progression. Furthermore, depletion of p21(Waf1/Cip1) by antisense strategy attenuated the PKC-induced cell cycle progression. These results suggest that PKC alpha activity controls glioma cell cycle progression through the upregulation of p21(Waf1/Cip1), which facilitates active cyclin-CDK complex formation.


Figures

FIG. 1
FIG. 1
Human glioma cell lines express the PKC isoforms α, δ, ɛ, η, μ, and ζ. (A) Expression of 11 PKC isoforms was examined in four different human glioma cell lines (U251N, U178, U563, and A172) and in two human fetal astrocyte primary cultures (64) by Western blotting using isoform-specific PKC antibodies as noted in Materials and Methods. The PKC species (and molecular masses) were α (82 kDa), β1 (80 kDa), β2 (80 kDa), γ (80 kDa), δ (78 kDa), ɛ (90 kDa), η (78 kDa), θ (79 kDa), μ (115 kDa), ι (74 kDa), and ζ (72 kDa). Protein extract from adult human brain was used as a positive control. Equal amounts of protein (100 μg) were loaded in each well. (B) Expression of the four conventional PKC isoforms (α, β1, β2, and γ) was analyzed by RT-PCR using isoform-specific primers in five human glioma cell lines (U251N, U178, U563, U373, and A172) and one human fetal astrocyte primary culture. RNA extracts from human adult brain were used as a positive control.
FIG. 2
FIG. 2
PKC activation with phorbol ester increases progression of human glioma cells through S and the G2-M phases of the cell cycle. (A) Flow cytometry analysis of PMA-treated U251N cells. (B) Flow cytometry analysis of untreated U251N cells. Asynchronously growing U251N cells were treated with 100 nM PMA or with vehicle only, collected at various time points, and stained with propidium iodide. For each side scatter plot, the y axis is the number of cells, while the x axis is the DNA content. Values from each scatter plot are graphed below panels A and B. Similar results after PMA treatment were obtained in over 10 independent experiments. (C) Immunofluorescence of cellular DNA stained with propidium iodide (PI) showing cells in interphase or at different stages of mitosis. U251N cells were grown on glass coverslips for 24 h, treated either with PMA or thymeleatoxin for 9 h, and then fixed.
FIG. 3
FIG. 3
PKC α and ɛ are the only isoforms translocated by PMA in glioma cells. Shown is Western blot analysis of the subcellular distribution between cytosolic and membrane fractions of the six PKC isoforms expressed in glioma cells following phorbol ester treatment using isoform-specific antibodies. U251N protein extracts collected at various times following PMA treatment were fractionated into cytosolic (C) and particulate (P) fractions; 30 μg of protein was loaded in each well. Only PKCs α and ɛ were translocated in response to PMA. Similar distribution following PMA treatment was also obtained for the U178 glioma cell line (data not shown). Note that in the doublet obtained for PKC ɛ, only the upper band (90 kDa) is the active form of the enzyme.
FIG. 4
FIG. 4
PKC α is necessary and sufficient to increase cell cycle progression. (A) Flow cytometry analysis of U251N glioma cells after thymeleatoxin treatment. Asynchronously growing U251N cells were stimulated with thymeleatoxin (100 nM), collected at various time points, and stained with propidium iodide for DNA content analysis. Similar results were obtained in over 10 independent experiments. (B) Western blot analysis of the subcellular localization of PKCs α and ɛ upon PMA or thymeleatoxin treatment between 0 and 72 h. PKC α was rapidly (within 1 h) translocated to the membrane by both PMA and thymeleatoxin and downregulated by 24 h; the protein remained undetectable at 72 h of treatment. On the other hand, PKC ɛ was translocated only upon PMA addition and was not downregulated at later time points. U251N protein extracts collected at various times following PMA or thymeleatoxin treatment were fractionated into cytosolic (C) and particulate (P) fractions; 30 μg of protein was loaded in each well. (C) Flow cytometry analysis of U178 glioma cells depleted of their endogenous PKC α by 48 h of PMA treatment and restimulated with PMA (time zero to 30 h). This shows the requirement for PKC α to be present in order to increase cell cycle progression in glioma cells. Similar results were obtained using thymeleatoxin to deplete PKC α and to restimulate the cells (data not shown). (D) PKC α regulates the growth rate of glioma cells. Twenty-five thousand cells were seeded for each cell line (U251N, control vector, ASα1, and ASα2). Four days later, cells were counted using a Coulter Counter; numbers are displayed in the top panel. Each clone was analyzed in quadruplicates. Results were analyzed using a one-way analysis of variance with Bonferroni multiple comparisons. ∗, P < 0.0001. Western blot using a monoclonal anti-PKC α antibody (Transduction Laboratories) (below) shows the endogenous PKC α level in each clone; 100 μg of protein was loaded in each well.
FIG. 5
FIG. 5
p21Waf1 mRNA is upregulated by PKC α activity, as determined by multiprobe RPA of U251N glioma cells RNA extracts in untreated (control), PMA-treated, or thymeleatoxin-treated cells at various time points; 5 μg of RNA was used for each reaction. RPA using the hCC-1 probe set shows a marked upregulation of p21 mRNA between 1 and 12 h following PMA or thymeleatoxin addition. p16 and CDK3 mRNAs were undetectable at all times. No change was detected in the various CDK mRNAs levels. These results are representative of three independent experiments.
FIG. 6
FIG. 6
Upregulation of the p21Waf1 protein following PKC α activation. (A) Western blot analysis of U251N glioma cells treated with PMA (100 nM) or thymeleatoxin (100 nM) or untreated shows a strong upregulation of the p21 protein following PMA or thymeleatoxin treatment. Gels show representative results of three independent experiments. (B) p21 levels over a 72-h period following PMA treatment of U251N cells; 40 μg of protein was loaded per well. Note that the exposure time for panel B was shorter than that for panel A to better assess the magnitude of p21 induction, thus explaining the apparently low p21 levels at 0, 36, 48, and 72 h.
FIG. 7
FIG. 7
Western blot analysis of various cell cycle-regulatory proteins following PMA treatment of U251N glioma cells. The data obtained by RPA were confirmed at the protein level. PMA treatment did not alter the protein levels of various cell cycle regulators; 60 μg of proteins was loaded per well. Results are representative of three independent experiments.
FIG. 8
FIG. 8
Increased association of p21Waf1/Cip1 with cyclin-CDK complexes following thymeleatoxin or PMA stimulation of U251N glioma cells. The formation of a ternary complex was accompanied by an increase in the kinase activity of the complexes. (A to D) Immunoprecipitates of cyclins A, B, and D1 at various times following thymeleatoxin or PMA stimulation of U251N cells were subjected to SDS-PAGE and blotted for each cyclin. They show that approximately equal amounts of cyclins were present in the cells throughout the duration of the experiment. Western blots (WB) for the CDK partners and p21 show the amount of protein coimmunoprecipitated along with the cyclin, as a ternary complex (Rα corresponds to rabbit antibody against the relevant target). For each immunoprecipitation (IP), the kinase activity of each complex was measured by its ability to phosphorylate histone H1 or Rb in vitro. The cyclin B-associated kinase activity at 3 h was not measured. As expected, an increasing amount of p21 was immunoprecipitated following PMA stimulation (E) p21 was detected using a monoclonal anti-p21 antibody (Transduction Laboratories). The p21-associated kinase activity appears correlated to the amount of p21 immunoprecipitated. Western blots and kinase assay results are representative of three independent experiments. The control lane in each panel refers to extracts subjected to protein G-coated agarose beads immunoprecipitation only.
FIG. 9
FIG. 9
p21Waf1/Cip1 upregulation is required for PKC-induced cell cycle progression. (A) Endogenous p21 protein level in the wild-type and empty vector-transfected cells (pREP1 and -4) and in p21 antisense-transfected cells (p21AS); 50 μg of protein was loaded per well. (B) Flow cytometry analysis of pREP1 and p21AS3 clones following PMA treatment. There is a marked reduction in the number of p21AS3 cells induced to progress through G2/M compared to empty vector-transfected cells (pREP1). For Western blot analysis of the p21 protein (bottom), extracts were collected at the same time as the flow cytometry samples. (C) Flow cytometry analysis of wild-type, empty vector-transfected, and p21 antisense-transfected cells at 6 and 9 h following PMA treatment. p21AS clones exhibit a marked reduction of the number of cells induced to progress through G2/M. ΔG2/M = % G2/M PMA treated − % G2/M control. Each bar is the mean of three independent experiments; the standard error of the mean for each cell line is plotted on the graph.

References

    1. Ahmad S, Mineta T, Martuza R L, Glazer R I. Antisense expression of protein kinase C alpha inhibits the growth and tumorigenicity of human glioblastoma cells. Neurosurgery. 1994;35:904–909. - PubMed
    1. Arita Y, Buffolino P, Coppock D L. Regulation of the cell cycle at the G2/M boundary in metastatic melanoma cells by 12-O-tetradecanoyl phorbol-13-acetate (TPA) by blocking p34cdc2 kinase activity. Exp Cell Res. 1998;242:381–390. - PubMed
    1. Baltuch G H, Shenouda G, Langleben A, Villemure J H. High dose tamoxifen in the treatment of recurrent high-grade glioma: a report of clinical stabilization and tumor regression. Can J Neurol Sci. 1993;20:168–170. - PubMed
    1. Baltuch G H, Dooley N P, Couldwell W T, Yong V W. Staurosporine differentially inhibits glioma versus non-glioma cell lines. J Neurooncol. 1993;16:141–147. - PubMed
    1. Baltuch G H, Dooley N P, Villemure J-G, Yong V W. Protein kinase C and growth regulation of malignant gliomas. Can J Neurol Sci. 1995;22:264–271. - PubMed

Publication types

MeSH terms