. 2000 Jul;20(13):4791-805.
doi: 10.1128/MCB.20.13.4791-4805.2000.

Phosphorylation of tyrosine residues in the kinase domain and juxtamembrane region regulates the biological and catalytic activities of Eph receptors

Affiliations

Phosphorylation of tyrosine residues in the kinase domain and juxtamembrane region regulates the biological and catalytic activities of Eph receptors

K L Binns et al. Mol Cell Biol. 2000 Jul.

Abstract

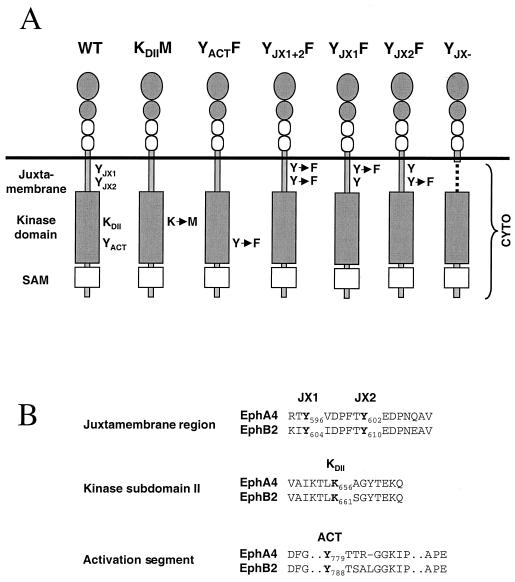
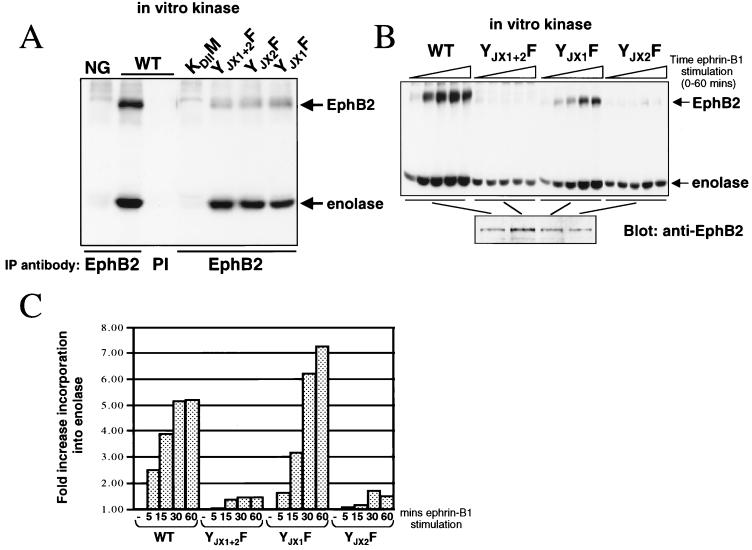
Members of the Eph family of receptor tyrosine kinases exhibit a striking degree of amino acid homology, particularly notable in the kinase and membrane-proximal regions. A mutagenesis approach was taken to address the functions of specific conserved tyrosine residues within these catalytic and juxtamembrane domains. Ligand stimulation of wild-type EphB2 in neuronal NG108-15 cells resulted in an upregulation of catalytic activity and an increase in cellular tyrosine phosphorylation, accompanied by a retraction of neuritic processes. Tyrosine-to-phenylalanine substitutions within the conserved juxtamembrane motif abolished these responses. The mechanistic basis for these observations was examined using the highly related EphA4 receptor in a continuous coupled kinase assay. Tandem mass spectrometry experiments confirmed autophosphorylation of the two juxtamembrane tyrosine residues and also identified a tyrosine within the kinase domain activation segment as a phosphorylation site. Kinetic analysis revealed a decreased affinity for peptide substrate upon substitution of activation segment or juxtamembrane tyrosines. Together, our data suggest that the catalytic and therefore biological activities of Eph receptors are controlled by a two-component inhibitory mechanism, which is released by phosphorylation of the juxtamembrane and activation segment tyrosine residues.


Figures

FIG. 1
FIG. 1
Ligand activation of EphB2 in NG108 cells results in neurite retraction. Parental (A′ and B′) and WT or mutant EphB2-transfected (C to M; D′ to M′) NG108 cells were differentiated with dibutyryl-cAMP and left untreated (columns 1 and 3) or challenged with 2 μg of soluble clustered Fc-ephrin-B1 per ml for 10 min (columns 2 and 4). Fixed cells were double stained for EphB2 (green; C to M) and filamentous actin (red [rhodamine-phalloidin]; A′ to M′). (A′ and B′) NG108 cells; (C to M and D′ to M′) NG108 clones stably expressing WT (C to E, D′, and E′), KDIIM (F, F′, G, and G′), YJX1+2F (H, H′, I, and I′), YJX1F (J, J′, K, and K′), or YJX2F (L, L′, M, and M′) forms of EphB2. (C) Specific EphB2 staining was competed with an excess of immunizing peptide. Arrows represent bundled actin filopodia.
FIG. 2
FIG. 2
EphB2 and EphA4 mutant constructs. (A) Schematic of EphA4 and EphB2 structures depicting juxtamembrane tyrosine residues JX1 (Y596 of EphA4/Y604 of EphB2), JX2 (Y602 of EphA4/Y610 of EphB2), activation segment tyrosine YACT (Y779 of EphA4), and the invariant lysine residue in kinase subdomain II (KDII; K661 of EphB2). Tyrosine residues were replaced with phenylalanine and KDII was replaced with methionine to produce mutant proteins as shown. The portion of the receptor used in EphA4CYTO is marked with a bracket. (B) Alignment of EphA4 and EphB2 amino acid sequences in the juxtamembrane and kinase subdomain regions.
FIG. 3
FIG. 3
Juxtamembrane mutations reduce tyrosine phosphorylation of EphB2 and p62dok in response to ephrin-B1 stimulation. NG-EphB2 clones expressing WT or mutant receptors (as indicated) were stimulated with 2 μg of soluble clustered Fc-ephrin-B1 per ml. Anti-EphB2 immunoprecipitates (A) or cytoplasmic lysates (B) were electrophoresed and blotted with antibodies to phosphotyrosine (anti-pTyr) (A and B, top panels), stripped and reprobed with anti-EphB2 (lower panels), and developed using a linear ECL system followed by PhosphorImager scanning. Ephrin-B1-induced phosphorylation of EphB2 (A and B) and p62dok (B) is reduced in EphB2YJX2F cells. An unidentified tyrosine phosphorylated protein of ∼70 kDa is absent from immunoprecititates of EphB2YJX1F and EphB2YJX2F receptors (arrow in panel A). (C) Graphical representation of EphB2 tyrosine phosphorylation in panel B, measured with a PhosphorImager.
FIG. 4
FIG. 4
Juxtamembrane mutations regulate ligand-induced EphB2 kinase activity. Lysates of parental NG108 (NG) cells or clones expressing WT or mutant EphB2 proteins (as indicated) were immunoprecipitated (IP) with anti-EphB2 or preimmune (PI) serum. The catalytic activity of the immunoprecipitated proteins was assessed using an IVK assay with enolase as an exogenous substrate. (A) Uninduced cells. (B) WT and mutant clones were stimulated with soluble clustered Fc-ephrin-B1 (2 μg/ml) for 0, 5, 15, 30, and 60 min (represented by open triangles) prior to lysis, immunoprecipitation, and IVK reaction. EphB2 expression in the clones was determined by blotting untreated samples for EphB2 (bottom panel) and developing using a linear ECL system. (C) Graphical representation of the mean fold increase in 32P incorporation into enolase measured from three representative experiments performed as for panel B. Incorporation was quantitated with a PhosphorImager.
FIG. 5
FIG. 5
EphA4CYTO is autophosphorylated at both juxtamembrane tyrosines JX1 and JX2. (A) A nano-ESI-MS (MS1) of in vitro-phosphorylated EphA4CYTO depicting the doubly charged ion peaks 958.4, 998.4, and 1,038.4 corresponding to the tryptic peptide TY596VDPFTY602EDPNQAVR (monoisotopic weight = 1,916.8 atomic mass units [amu] [M]) in the unphosphorylated (M), singly phosphorylated (M + P), and doubly phosphorylated (M + 2P) states, respectively (P = phosphate [amu]; q = charge). (B) nano-ESI-MS (MS2) product ion spectra generated by collisionally induced dissociation of the unphosphorylated 958.4 ion. Singly charged peptide ion peaks, differing in mass by one amino acid, are marked by arrows (y series, C-terminal portions of peptide fragments, boldface arrows; b series, N-terminal portions of peptide fragments, lightface arrows). (C and D) MS2 product ion spectra of the 998.4 ion peak with single phosphorylation on Y596 (C) or Y602 (D). An increase in mass difference of 80 amu (corresponding to one phosphate) is observed between the singly charged ions b1 and b2 (C) and between y8 and y9 (D) compared to the corresponding ion peaks in the unphosphorylated spectrum (B). Ion peaks representing the fragments of the tryptic peptide that do not contain the phosphorylated tyrosine (pTyr) (b1 in C and y8 in D) are identical between the spectra.
FIG. 6
FIG. 6
EphA4CYTO is phosphorylated at the putative activation loop tyrosine YACT. (A) A nano-ESI-MS (MS1) spectrum indentifying doubly charged ion peaks corresponding to the unphosphorylated (740.3) and phosphorylated (780.3) forms of the tryptic peptide VLEDDPEAY779TTR (1480.6 amu). (B and C) MS2 spectra of the phosphorylated and unphosphorylated ions illustrating the 80 amu (one phosphate) increase in mass of singly charged peptides (arrows) retaining YACT in the 780.3-derived spectrum (B) versus the 740.3-derived spectrum (C). Peak intensity ratios of phosphorylated and unphosphorylated ions (panel A and Fig. 5A) are not quantitative due to differing ionization potentials and desalting-column elution and retention profiles between peptides.
FIG. 7
FIG. 7
EphA4CYTO requires an induction time for maximum catalytic activity. (A) i, Sephadex 200 size exclusion column fractions were subjected to SDS-PAGE and stained with Coomassie blue to analyze protein purity. Fractions 10 and 11 were routinely concentrated and used for subsequent analysis. ii, equivalent amounts of bacterially expressed EphA4CYTO, were thrombin cleaved with (+) and without (−) the presence of AP, purified, electrophoresed, and blotted with antibodies to phosphotyrosine (anti-pTyr), illustrating the complete dephosphorylation upon AP treatment (described in Materials and Methods). Protein concentration was determined by UV spectrometry using molar coefficients and confirmed by SDS-PAGE iii, progress curve of the phosphorylation of 0.3 mM S-1 peptide in a standard reaction mixture containing 0.5 mM ATP and 0.2 μM dephosphorylated EphA4CYTO depicting the initial and steady-state phases of a typical reaction. Induction time was estimated from the intersection of asymptotes as illustrated. (B) The induction time is dependent on kinase and ATP concentrations. Reactions were performed with 0.15 mM S-1 peptide under standard conditions and WT EphA4CYTO concentrations from 0.36 μM to 4.8 μM in 0.5 mM ATP (i) or ATP concentrations from 0.5 to 2 mM with 0.24 μM WT EphA4CYTO (ii). Induction times were calculated from progress curves as illustrated in panel A, iii. iii, progress curves of the phosphorylation of 0.15 mM S-1 peptide in standard reaction conditions with (■) or without (▴) 1 h of preincubation of the WT EphA4CYTO in 2 mM ATP–10 mM MgCl2. Final concentration of kinase was 3.6 μM. (C) Dependence of the induction time of EphA4YACTF catalytic activity on kinase concentration from 0.7 to 4 μM at 0.5 mM ATP (i) and on ATP concentration from 0.5 to 2 mM with 3.4 μM EphA4YACTF (ii) iii, progress curves of the phosphorylation of 1.2 mM S-1 peptide with (■) or without (▴) 1 h of preincubation of the EphA4YACTF in 2 mM ATP–10 mM MgCl2. (D) Progress curves of the phosphorylation of 0.31 mM S-1 peptide by 0.76 μM EphA4YJX1+2F kinase with (■) or without (▴) 2 h of preincubation of the kinase in 2 mM ATP–10 mM MgCl2.
FIG. 7
FIG. 7
EphA4CYTO requires an induction time for maximum catalytic activity. (A) i, Sephadex 200 size exclusion column fractions were subjected to SDS-PAGE and stained with Coomassie blue to analyze protein purity. Fractions 10 and 11 were routinely concentrated and used for subsequent analysis. ii, equivalent amounts of bacterially expressed EphA4CYTO, were thrombin cleaved with (+) and without (−) the presence of AP, purified, electrophoresed, and blotted with antibodies to phosphotyrosine (anti-pTyr), illustrating the complete dephosphorylation upon AP treatment (described in Materials and Methods). Protein concentration was determined by UV spectrometry using molar coefficients and confirmed by SDS-PAGE iii, progress curve of the phosphorylation of 0.3 mM S-1 peptide in a standard reaction mixture containing 0.5 mM ATP and 0.2 μM dephosphorylated EphA4CYTO depicting the initial and steady-state phases of a typical reaction. Induction time was estimated from the intersection of asymptotes as illustrated. (B) The induction time is dependent on kinase and ATP concentrations. Reactions were performed with 0.15 mM S-1 peptide under standard conditions and WT EphA4CYTO concentrations from 0.36 μM to 4.8 μM in 0.5 mM ATP (i) or ATP concentrations from 0.5 to 2 mM with 0.24 μM WT EphA4CYTO (ii). Induction times were calculated from progress curves as illustrated in panel A, iii. iii, progress curves of the phosphorylation of 0.15 mM S-1 peptide in standard reaction conditions with (■) or without (▴) 1 h of preincubation of the WT EphA4CYTO in 2 mM ATP–10 mM MgCl2. Final concentration of kinase was 3.6 μM. (C) Dependence of the induction time of EphA4YACTF catalytic activity on kinase concentration from 0.7 to 4 μM at 0.5 mM ATP (i) and on ATP concentration from 0.5 to 2 mM with 3.4 μM EphA4YACTF (ii) iii, progress curves of the phosphorylation of 1.2 mM S-1 peptide with (■) or without (▴) 1 h of preincubation of the EphA4YACTF in 2 mM ATP–10 mM MgCl2. (D) Progress curves of the phosphorylation of 0.31 mM S-1 peptide by 0.76 μM EphA4YJX1+2F kinase with (■) or without (▴) 2 h of preincubation of the kinase in 2 mM ATP–10 mM MgCl2.
FIG. 8
FIG. 8
Comparison of reaction velocities of the EphA4CYTO WT and mutant proteins. (A) Comparison of specific activities of EphA4CYTO WT and mutant proteins. Reactions were performed with 0.1 mM S-1 peptide and 10.8 μM preincubated kinase using WT, mutant, and juxtamembrane-deleted (JX-) EphA4CYTO protein as indicated. Velocities are the means of three separate determinations. (B) Progress curves of EphA4CYTO WT (◊) and (JX-) EphA4CYTO (⧫) illustrating the reduced lag time observed upon truncation of the juxtamembrane region. Reactions were performed as described for panel A.
FIG. 9
FIG. 9
(A) Representative Hanes plots ([S] versus [S/V]) of the substrate concentrations and velocities derived from a single determination of KmATP values for preincubated EphA4CYTO WT (▴), YACTF (■), YJX1F (⧫), YJX2F (●), and YJX1+2F (○). ATP concentration was varied from 0.1 to 2.0 mM. Peptide concentration was held fixed at 8.15 mM for YACTF and YJX1+2F and 2 mM for WT, YJX1F, and YJX2F proteins based on calculations of peptide Km and maximum solubility. (B) Representative Hanes plots derived from KmPEP for preincubated EphA4CYTO WT (▴), YACTF (■), YJX1F (⧫), and YJX2F (●). Peptide concentrations were varied from 0.012 to 1.5 mM. ATP concentrations were held fixed at 2 mM.

References

    1. Barker S C, Kassel D B, Weigl D, Huang X, Luther M A, Knight W B. Characterization of pp60c-src tyrosine kinase activities using a continuous assay: autoactivation of the enzyme is an intermolecular autophosphorylation process. Biochemistry. 1995;34:14843–14851. - PubMed
    1. Baxter R M, Secrist J P, Vaillancourt R R, Kazlauskas A. Full activation of the platelet-derived growth factor beta-receptor kinase involves multiple events. J Biol Chem. 1998;273:17050–17055. - PubMed
    1. Becker N, Seitanidou T, Murphy P, Mattei M G, Topilko P, Nieto M A, Wilkinson D G, Charnay P, Gilardi H P. Several receptor tyrosine kinase genes of the Eph family are segmentally expressed in the developing hindbrain. Mech Dev. 1994;47:3–17. - PubMed
    1. Bohme B, VandenBos T, Cerretti D P, Park L S, Holtrich U, Rubsamen-Waigmann H, Strebhardt K. Cell-cell adhesion mediated by binding of membrane-anchored ligand LERK-2 to the EPH-related receptor human embryonal kinase 2 promotes tyrosine kinase activity. J Biol Chem. 1996;271:24747–24752. - PubMed
    1. Bruckner K, Pasquale E B, Klein R. Tyrosine phosphorylation of transmembrane ligands for Eph receptors. Science. 1997;275:1640–1643. - PubMed

Publication types

MeSH terms