. 2000 Jun;11(6):2131-50.
doi: 10.1091/mbc.11.6.2131.

Sorting of membrane and fluid at the apical pole of polarized Madin-Darby canine kidney cells

Affiliations
Free PMC article

Sorting of membrane and fluid at the apical pole of polarized Madin-Darby canine kidney cells

S M Leung et al. Mol Biol Cell. 2000 Jun.
Free PMC article

Abstract

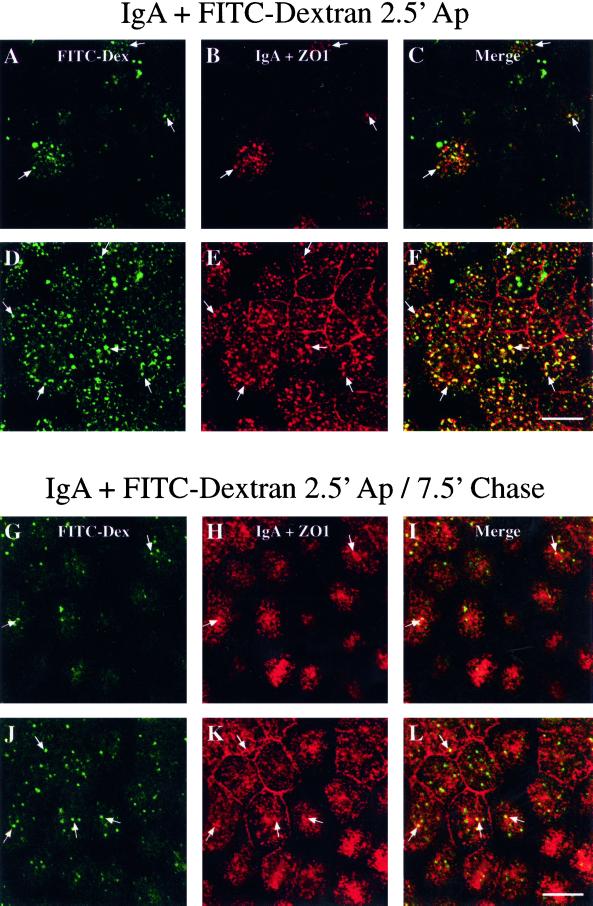
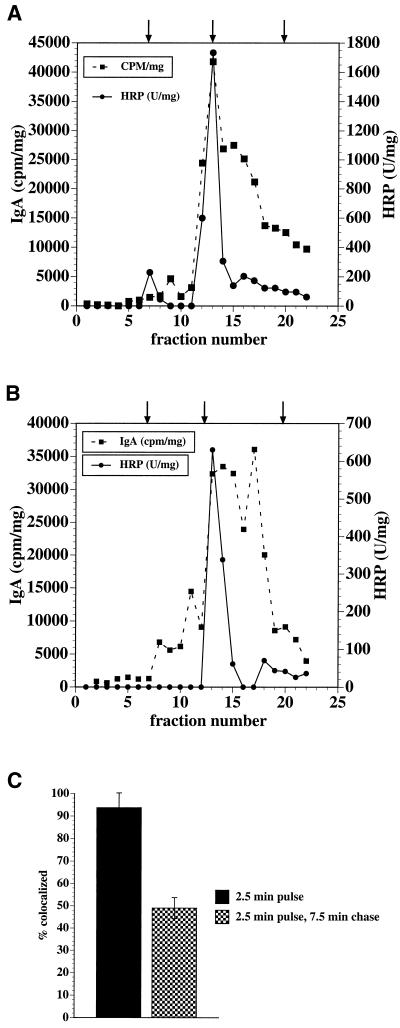
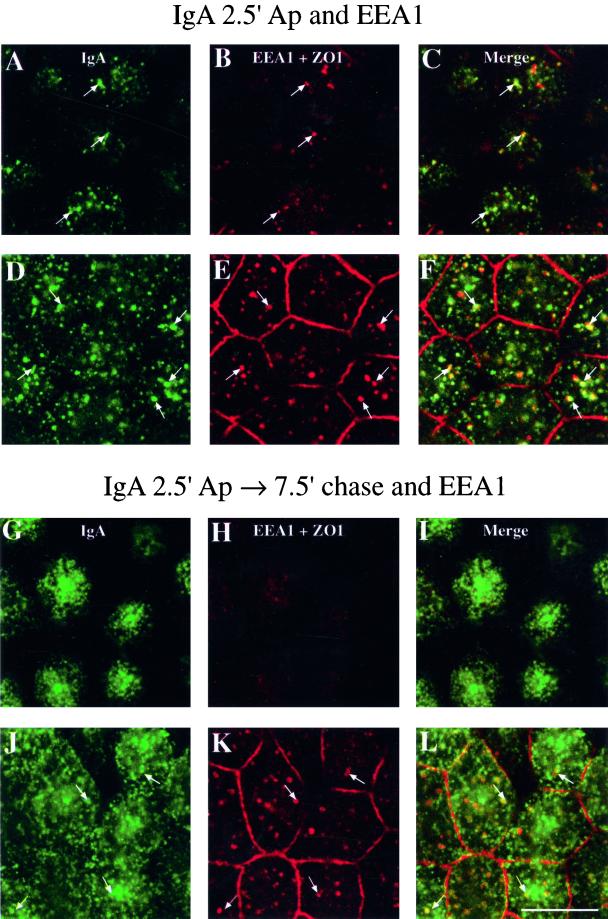
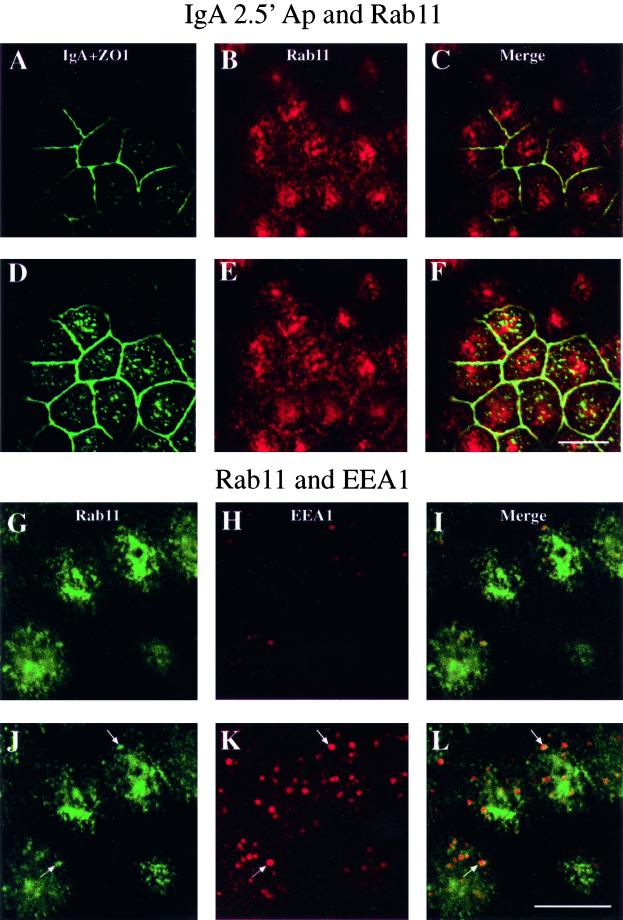
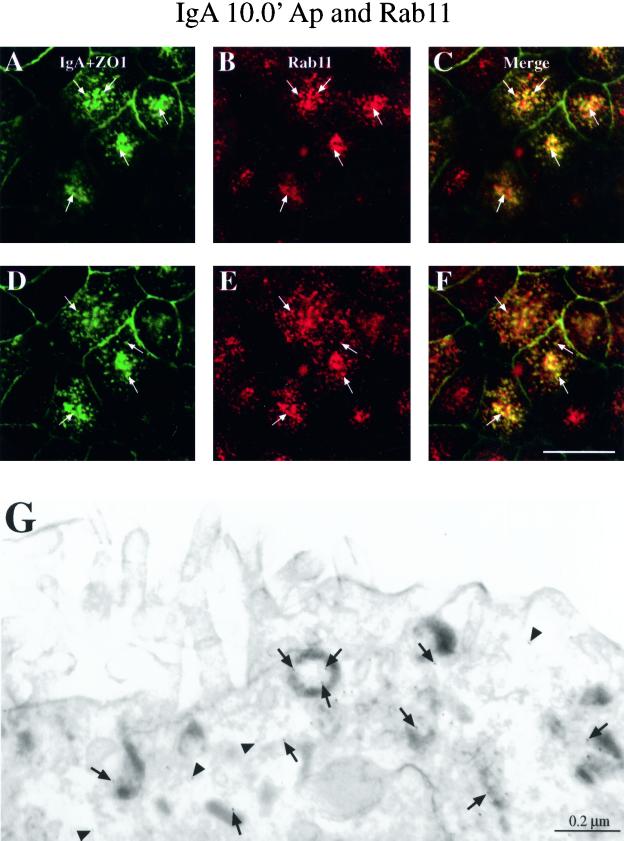
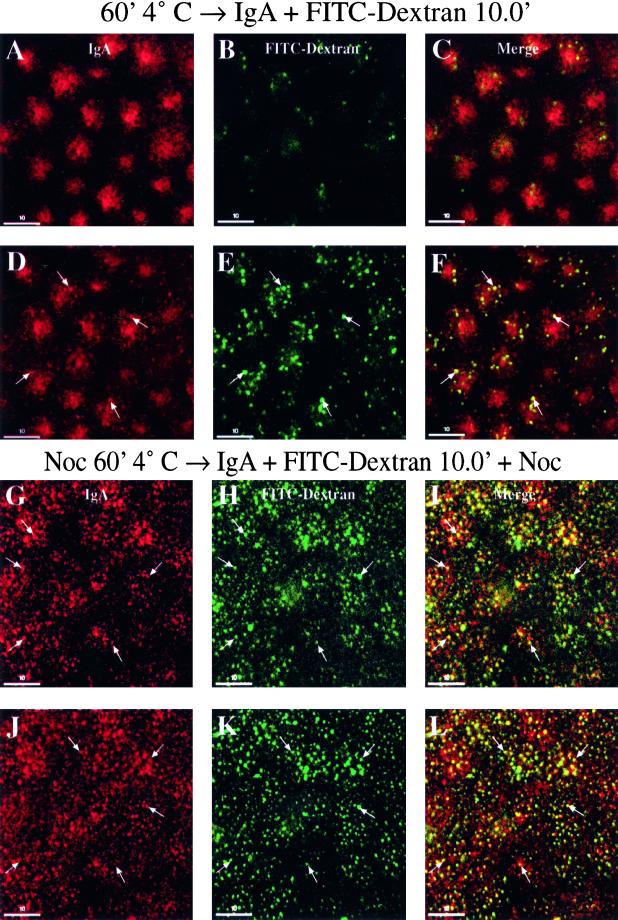
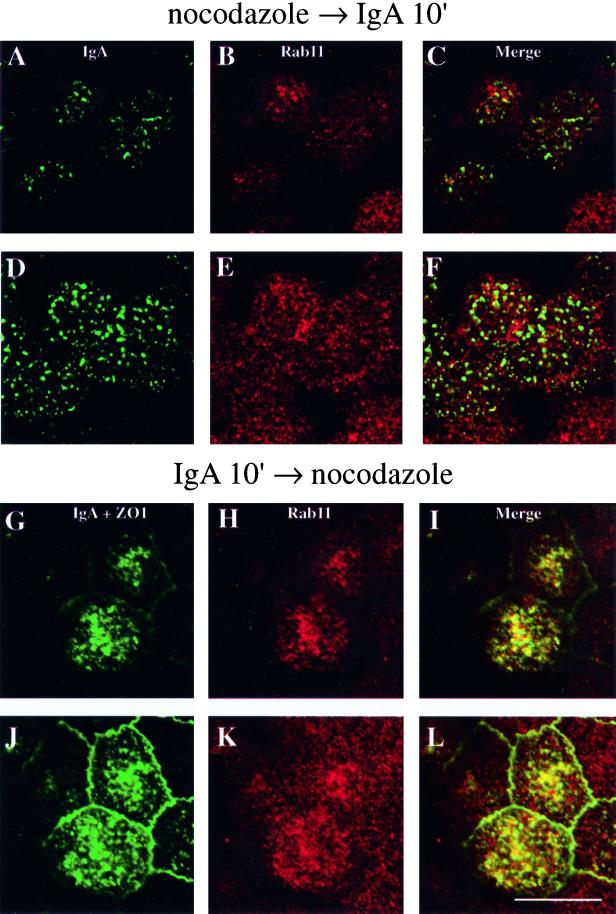
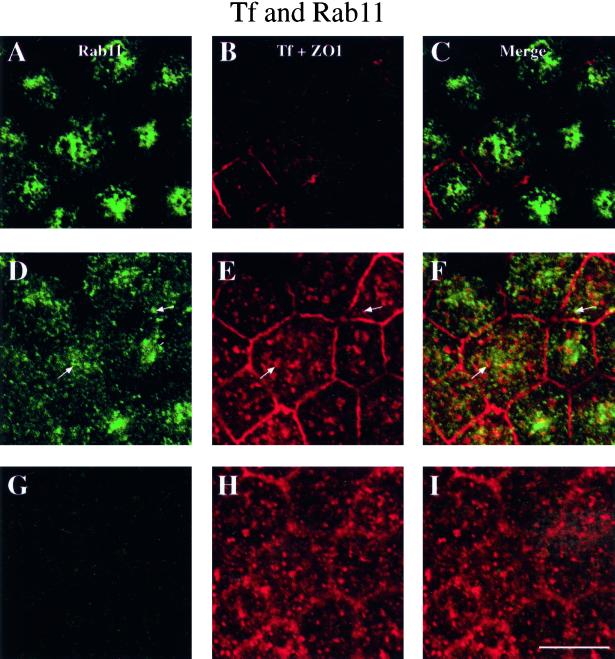
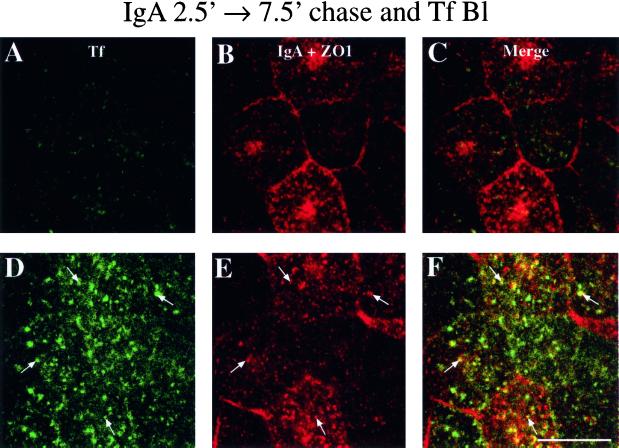
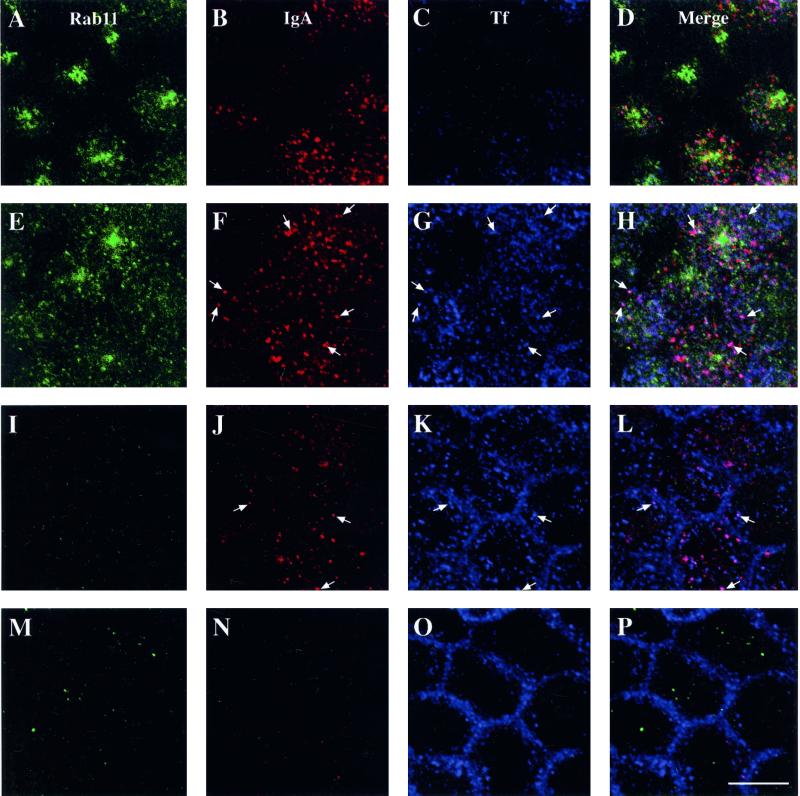
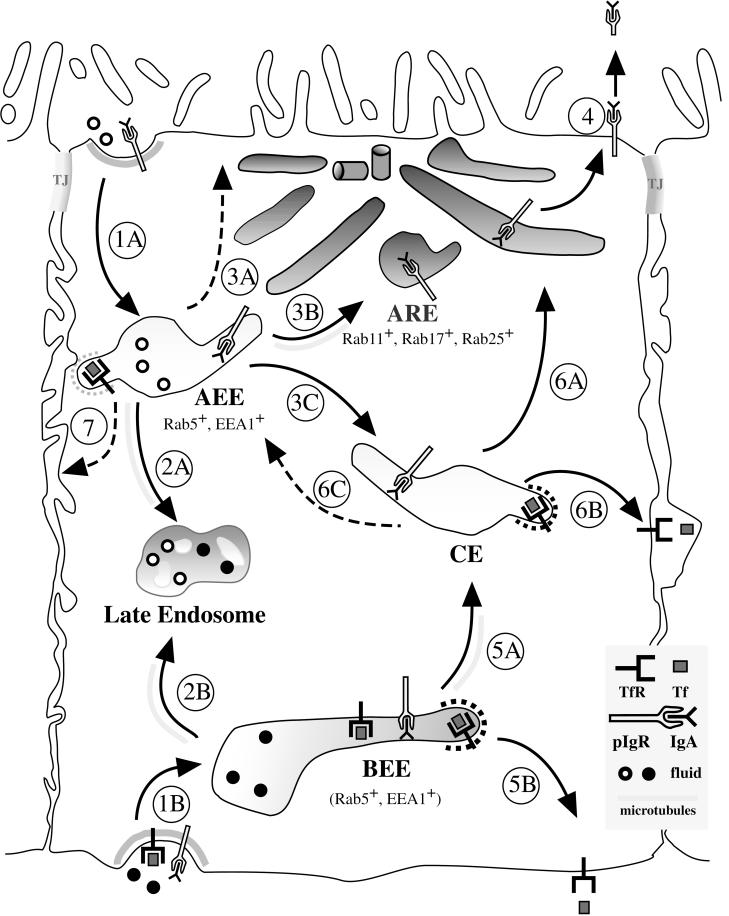
When fluid-phase markers are internalized from opposite poles of polarized Madin-Darby canine kidney cells, they accumulate in distinct apical and basolateral early endosomes before meeting in late endosomes. Recent evidence suggests that significant mixing of apically and basolaterally internalized membrane proteins occurs in specialized apical endosomal compartments, including the common recycling endosome and the apical recycling endosome (ARE). The relationship between these latter compartments and the fluid-labeled apical early endosome is unknown at present. We report that when the apical recycling marker, membrane-bound immunoglobulin A (a ligand for the polymeric immunoglobulin receptor), and fluid-phase dextran are cointernalized from the apical poles of Madin-Darby canine kidney cells, they enter a shared apical early endosome (</=2.5 min at 37 degrees C) and are then rapidly segregated from one another. The dextran remains in the large supranuclear EEA1-positive early endosomes while recycling polymeric immunoglobulin receptor-bound immunoglobulin A is delivered to a Rab11-positive subapical recycling compartment. This latter step requires an intact microtubule cytoskeleton. Receptor-bound transferrin, a marker of the basolateral recycling pathway, has limited access to the fluid-rich apical early endosome but is excluded from the subapical elements of the Rab11-positive recycling compartment. We propose that the term ARE be used to describe the subapical Rab11-positive compartment and that the ARE is distinct from both the transferrin-rich common recycling endosome and the fluid-rich apical early endosome.


Figures

Figure 1
Figure 1
Distribution of IgA and FITC-dextran cointernalized from the apical pole of the cell for 2.5 min at 37°C (A–F) or with a 2.5-min pulse followed by a 7.5-min chase at 37°C (G–L). After IgA and FITC-dextran internalization, the cells were rapidly cooled, cell surface IgA was removed by trypsin treatment, and the cells were fixed with paraformaldehyde-lysine-periodate fixative. The fixed cells were incubated with IgA- and ZO1-specific primary antibodies and then reacted with CY5-labeled secondary antibodies. The CY5 signal is shown in the center panels, the FITC signal is shown in the left panels, and merged images of the CY5 and FITC signals are shown in the right panels. ZO1 appears as a thin red line at the periphery of each cell. Single optical sections, obtained with a confocal microscope, are shown from the apex of the cell (A–C and G–I) or at the level of the tight junctions (D–F and J–L). Note that the cells in the lower right corner of each panel, in panels G–L, are shorter than the cells in the upper left corner. Representative regions of colocalization are marked with arrows. Bars, 10 μm.
Figure 2
Figure 2
Colocalization of fluid and membrane markers assessed by sucrose flotation gradients and by density-shift assays. (A and B) Sucrose flotation gradients. [125I]IgA and 5 mg/ml HRP were cointernalized for 2.5 min at 37°C from the apical poles of MDCK cells, and the cells were either rapidly chilled (A) or chased in marker-freemedium for 7.5 min at 37°C (B). The cells were homogenized, a postnuclear supernatant was generated, and the postnuclear supernatant (adjusted to 40.2% sucrose) was overlaid with 35, 25, and 8.5% (wt/wt) sucrose solutions. The samples were centrifuged, and 0.45-ml fractions were collected from the top of the gradient. Samples of each fraction were assayed for protein content, associated [125I]IgA (cpm), and HRP activity. The interfaces between the 40.2 and 35% sucrose layers, the 35 and 25% sucrose layers, and the 25 and 8.5% sucrose layers are indicated, from right to left, by arrows atop the panels. Data from a representative experiment are shown. (C) Density-shift assay. [125I]IgA and 5 mg/ml HRP were cointernalized for 2.5 min at 37°C from the apical poles of MDCK cells, and the cells were either rapidly chilled or chased in marker-free medium for 7.5 min at 37°C. Cell surface [125I]IgA was removed by trypsin treatment at 4°C. A DAB reaction was performed, cells were lysed in detergent, and the lysates were centrifuged. Details of the quantitation are given in MATERIALS AND METHODS. Results are mean ± SD (n ≥ 3).
Figure 3
Figure 3
Distribution of EEA1 and apically internalized IgA in polarized MDCK cells. IgA was internalized for 2.5 min at 37°C from the apical poles of MDCK cells, and the cells were either rapidly chilled (A–F) or chased in marker-free medium for 7.5 min at 37°C (G–L). After IgA internalization, the cells were rapidly cooled, cell surface IgA was removed by trypsin treatment, and the cells were fixed with the use of a pH-shift protocol. The fixed cells were incubated with primary antibodies directed against IgA, ZO1, or EEA1 and then reacted with either FITC- or CY5-labeled secondary antibodies. The FITC signal is shown in the left panels, the CY5 signal is shown in the center panels, and merged images of the FITC and CY5 signals are shown in the right panels. ZO1 appears as a thin red line at the periphery of each cell. Single optical sections, obtained with a confocal microscope, are shown from the apex of the cell (A–C and G–I) or at the level of the tight junctions (D–F and J–L). Representative regions of colocalization are marked with arrows. Bar, 10 μm.
Figure 4
Figure 4
Distribution of IgA-labeled AEE, Rab11, and EEA1 in polarized MDCK cells. (A–F) IgA was internalized for 2.5 min at 37°C from the apical poles of MDCK cells. The cells were then rapidly chilled, cell surface IgA was removed by trypsin treatment, and the cells were fixed with the use of a pH-shift protocol. (G–L) Cells were immediately fixed. In A–L, the fixed cells were incubated with primary antibodies directed against IgA, Rab11, ZO1, or EEA1 and then reacted with either FITC- or CY5-labeled secondary antibodies. The FITC signal is shown in the left panels, the CY5 signal is shown in the center panels, and merged images of the FITC and CY5 signals are shown in the right panels. In A–F, ZO1 appears as a thin green line at the periphery of each cell. Single optical sections, obtained with a confocal microscope, are shown from the apex of the cell (A–C and G–I) or at or near the level of the tight junctions (D–F and J–L). Representative regions of colocalization are marked with arrows. Bars, 10 μm.
Figure 5
Figure 5
Distribution of IgA and Rab11 in polarized MDCK cells. (A–F) IgA was internalized from the apical poles of MDCK cells for 10 min at 37°C. The cells were then rapidly chilled, cell surface IgA was removed by trypsin treatment, and the cells were fixed with the use of a pH-shift protocol. The fixed cells were incubated with primary antibodies directed against IgA, Rab11, or ZO1 and then reacted with either FITC- or CY5-labeled secondary antibodies. The FITC signal is shown in the left panels, the CY5 signal is shown in the center panels, and merged images of the FITC and CY5 signals are shown in the right panels. ZO1 appears as a thin green line at the periphery of each cell. Single optical sections, ∼1 μm apart, are shown from the apical region of the cell. Representative regions of colocalization are marked with arrows. Bar, 10 μm. (G) IgA-HRP was internalized from the apical poles of the cells for 10 min at 37°C, the cells were fixed with the use of a pH-shift protocol, and a DAB reaction was performed. The cells were permeabilized with digitonin and then reacted with anti-Rab11 antibodies, followed by protein A coupled to 5-nm colloidal gold particles. The cells were then processed for electron microscopy as described in MATERIALS AND METHODS. A semithick section (∼250 nm) is shown. Arrows, examples of structures in which IgA-HRP and Rab11 colocalize; arrowheads, examples of areas in which Rab11 is found in the absence of IgA-HRP. Bar, 0.2 μm.
Figure 6
Figure 6
Distribution of IgA and FITC-dextran in control and nocodazole-treated cells. (A–F) Cells were incubated for 60 min at 4°C, and IgA and FITC-dextran were cointernalized for 10 min at 37°C from the apical poles of MDCK cells. (G–L) Cells were treated with nocodazole for 60 min at 4°C, and IgA and FITC-dextran were cointernalized (in the continued presence of nocodazole) from the apical poles of the cells for 10 min at 37°C. In A–L, the cells were rapidly chilled, cell surface IgA was removed by trypsin treatment, and the cells were fixed with the use of a periodate-lysine-paraformaldehyde fixative. The fixed cells were incubated with primary antibodies directed against IgA and then reacted with CY5-labeled secondary antibodies. The CY5 signal is shown in the left panels, the FITC signal is shown in the center panels, and merged images of the CY5 and FITC signals are shown in the right panels. Single optical sections, obtained with a confocal microscope, are shown from the apex of the cell (A–C and G–I) or 1–2 μm below the level of the previous section (D–F and J–L). Representative regions of colocalization are marked with arrows. Bars, 10 μm.
Figure 7
Figure 7
Distribution of Rab11 and IgA in nocodazole-treated cells. (A–F) Cells were treated with nocodazole for 60 min at 4°C and then for 10 min at 37°C. Subsequently, IgA and FITC-dextran were cointernalized from the apical poles of MDCK cells for 10 min at 37°C in the continued presence of nocodazole. (G–L) IgA was internalized from the apical poles of the cells for 10 min at 37°C. The cells were then rapidly chilled, treated with nocodazole for 60 min at 4°C, and warmed for 10 min at 37°C in the continued presence of nocodazole. In A–L, the cells were rapidly chilled, cell surface IgA was removed by trypsin treatment, and the cells were fixed with the use of a pH-shift protocol. The fixed cells were incubated with primary antibodies directed against IgA, Rab11, or ZO1 and then reacted with FITC- or CY5-labeled secondary antibodies. The FITC signal is shown in the left panels, the CY5 signal is shown in the center panels, and merged images of the FITC and CY5 signals are shown in the right panels. In G–L, ZO1 appears as a thin green line that surrounds each cell. Single optical sections, obtained with a confocal microscope, are shown from the apex of the cell (A–C and G–I) or at or near the level of the tight junctions (D–F and J–L). Bar, 10 μm.
Figure 8
Figure 8
Distribution of Tf and Rab11 in polarized MDCK cells. Tf was internalized from the basolateral poles of the cells for 30 min at 37°C. The cells were fixed, incubated with primary antibodies directed against Rab11, ZO1, or Tf, and then reacted with either CY5- or FITC-labeled secondary antibodies. The FITC signal is shown in the left panels, the CY5 signal is shown in the center panels, and merged images of the FITC and CY5 signals are shown in the right panels. ZO1 appears as a thin red line at the periphery of each cell. Single optical sections, obtained with a confocal microscope, are shown from the apex of the cell (A–C), at or near the level of the tight junctions (D–F), or directly above the nucleus (G–I). Representative regions of colocalization are marked with arrows. Bar, 10 μm.
Figure 9
Figure 9
Distribution of Tf and IgA. IgA was internalized from the apical poles of the cells for 2.5 min at 37°C and then incubated in marker-free medium for 7.5 min at 37°C. The cells were rapidly chilled, cell surface IgA was removed by trypsin treatment, and the cells were fixed with the use of a pH-shift protocol. The fixed cells were incubated with primary antibodies directed against IgA, ZO1, or Tf and then reacted with either CY5- or FITC-labeled secondary antibodies. The FITC signal is shown in the left panels, the CY5 signal is shown in the center panels, and merged images of the FITC and CY5 signals are shown in the right panels. ZO1 appears as a thin red line at the periphery of each cell. Optical sections are shown from the apical region of the cell just below the apical plasma membrane (A–C) or in sections near the level of the tight junctions (D–F). Representative regions of colocalization are marked with arrows. Bar, 10 μm.
Figure 10
Figure 10
Distribution of Tf, IgA-labeled AEE, and Rab11 in polarized MDCK cells. Tf was internalized from the basolateral poles of the cells for 30 min at 37°C. During the last 2.5 min of this internalization period, IgA was added to the apical poles of the cells. At the end of the experiment, the cells were rapidly chilled, cell surface IgA was removed by trypsin treatment, and the cells were fixed with the use of a pH-shift protocol. The cells were incubated with primary antibodies directed against Rab11, IgA, or Tf and then reacted with either CY5-, CY3-, or FITC-labeled secondary antibodies. The FITC signal (in green) is shown in the left panels, the CY3 signal (in red) is shown in the center left panels, the CY5 signal (in blue) is shown in the center right panels, and merged images of the FITC, CY3, and CY5 signals are shown in the right panels. Single optical sections, obtained with a confocal microscope, are shown from the apex of the cell (A–D), at or near the level of the tight junctions (E–H), directly above the nucleus (I–L), or along the lateral margins of the cell near its base (M–P). Note that the cells in the lower right corner of each panel are taller than the cells in the upper left corner. Regions of colocalization of IgA and Tf appear magenta in the merged images, and representative regions of colocalization are indicated by arrows. Bar, 10 μm.
Figure 11
Figure 11
Model for endocytic traffic in polarized MDCK cells. Upon internalization, fluid and membrane are delivered to distinct AEE (step 1A) or BEE (step 1B). Although some fluid can recycle (step 3A) or transcytose (step 7) from these compartments, some is also delivered in a microtubule-dependent step to late endosomes (steps 2A and 2B) and ultimately lysosomes (not shown). Apical recycling proteins are delivered to the ARE (step 3B) or the CE (step 3C) before their ultimate release from the apical pole of the cell (step 4). Some membrane/fluid may recycle directly from the AEE (step 3A). Basolateral recycling proteins (i.e., receptor-bound Tf) as well as proteins transcytosing in the basolateral-to-apical direction (i.e., pIgR–IgA) enter a shared BEE (step 1B). Although some receptor-bound Tf may recycle directly from this compartment (step 5B), a significant fraction is delivered to the CE along with the majority of the pIgR–IgA (step 5A). This translocation step is thought to require microtubules. The majority of the receptor-bound Tf is thought to recycle from the CE (step 6B); however, a fraction is delivered to the AEE (step 6C) and may recycle from this compartment (step 7). The transcytosing pIgR–IgA complexes, as well as apical recycling pIgR–IgA complexes, are delivered from the CE to the ARE (step 6A) and are ultimately released at the apical pole of the cell (step 4).

Similar articles

Cited by

References

    1. Apodaca G, Katz LA, Mostov KE. Receptor-mediated transcytosis of IgA in MDCK cells is via apical recycling endosomes. J Cell Biol. 1994;125:67–86. - PMC - PubMed
    1. Barroso M, Sztul E. Basolateral to apical transcytosis in polarized cells is indirect and involves BFA and trimeric G protein sensitive passage through the apical endosome. J Cell Biol. 1994;124:83–100. - PMC - PubMed
    1. Bomsel M, Parton R, Kuznetsov SA, Schroer TA, Gruenberg J. Microtubule- and motor-dependent fusion in vitro between apical and basolateral endocytic vesicles from MDCK cells. Cell. 1990;62:719–731. - PubMed
    1. Bomsel M, Prydz K, Parton RG, Gruenberg J, Simons K. Endocytosis in filter-grown Madin-Darby canine kidney cells. J Cell Biol. 1989;109:3243–3258. - PMC - PubMed
    1. Breitfeld P, Casanova JE, Harris JM, Simister NE, Mostov KE. Expression and analysis of the polymeric immunoglobulin receptor. Methods Cell Biol. 1989a;32:329–337. - PubMed

Publication types

LinkOut - more resources