. 2000 Jul;182(13):3809-15.
doi: 10.1128/JB.182.13.3809-3815.2000.

Physical morphology and surface properties of unsaturated Pseudomonas putida biofilms

Affiliations

Physical morphology and surface properties of unsaturated Pseudomonas putida biofilms

I D Auerbach et al. J Bacteriol. 2000 Jul.

Abstract

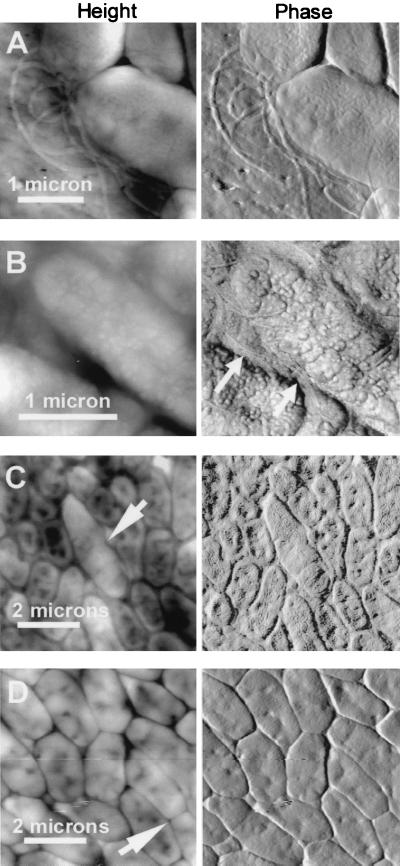
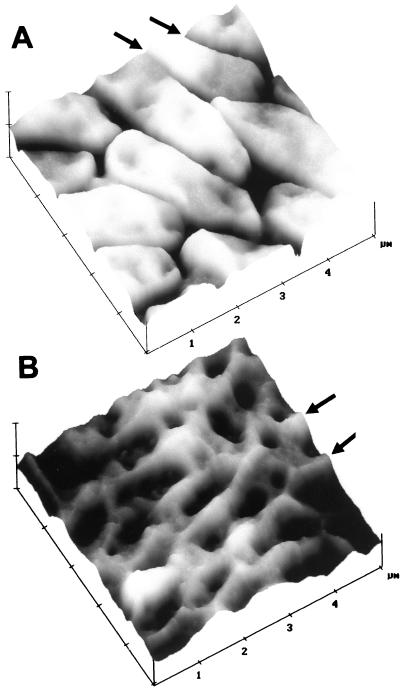
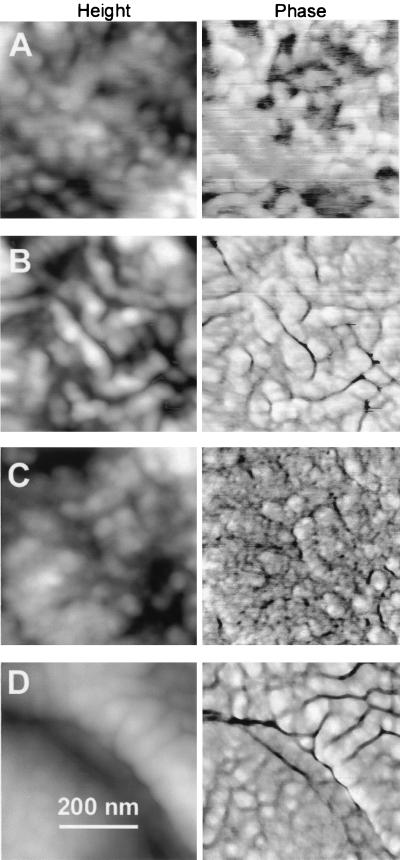
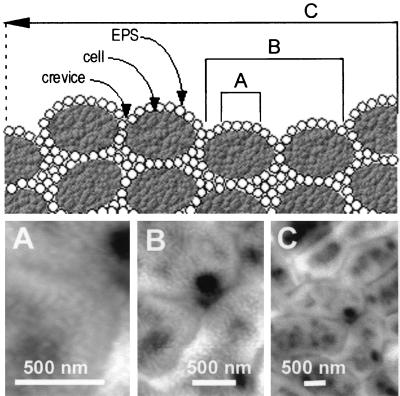
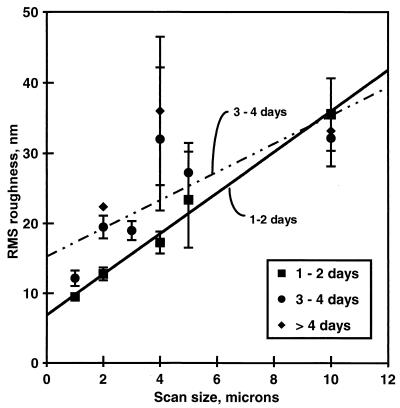
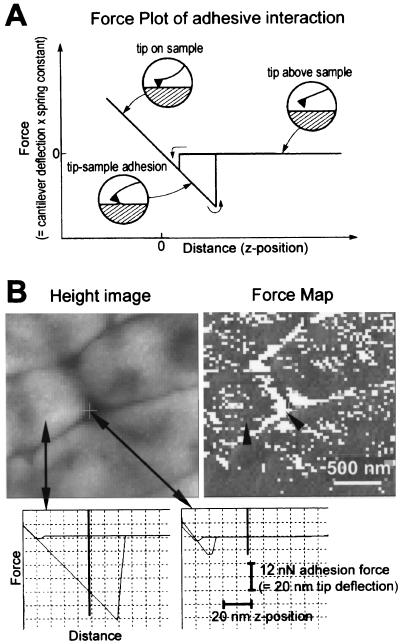
Unsaturated biofilms of Pseudomonas putida, i.e., biofilms grown in humid air, were analyzed by atomic force microscopy to determine surface morphology, roughness, and adhesion forces in the outer and basal cell layers of fresh and desiccated biofilms. Desiccated biofilms were equilibrated with a 75.5% relative humidity atmosphere, which is far below the relative humidity of 98 to 99% at which these biofilms were cultured. In sharp contrast to the effects of drying on biofilms grown in fluid, we observed that drying caused little change in morphology, roughness, or adhesion forces in these unsaturated biofilms. Surface roughness for moist and dry biofilms increased approximately linearly with increasing scan sizes. This indicated that the divides between bacteria contributed more to overall roughness than did extracellular polymeric substances (EPS) on individual bacteria. The EPS formed higher-order structures we termed mesostructures. These mesostructures are much larger than the discrete polymers of glycolipids and proteins that have been previously characterized on the outer surface of these gram-negative bacteria.


Figures

FIG. 1
FIG. 1
Bacterial flagella (A and B) and bacteria during cell division (C and D, arrows). Flagella were seen both on the filter adjacent to biofilm bacteria (A) and nestled between bacteria (B, arrows). Shown are height (left) and phase (right) AFM images of unsaturated P. putida mt-2 biofilms. Before AFM imaging, biofilms were 1 day old, unwashed and undesiccated (A), 3 days old, unwashed and desiccated (B), 2 days old, washed and desiccated (C), and 4 days old, unwashed and desiccated (D).
FIG. 2
FIG. 2
Biofilm bacteria with crevasses (A) and ridges (B) between cells. Surface plots of AFM height images emphasized surface corrugations. Z (height) scales are 250 (A) and 150 (B) nm/division. Unsaturated P. putida mt-2 biofilms were unwashed, desiccated, and 4 (A) or 3 (B) days old before AFM imaging.
FIG. 3
FIG. 3
EPS by AFM on unsaturated P. putida mt-2 biofilms according to sample preparation treatment and age. Before AFM imaging, biofilms were 1 day old, unwashed and desiccated (A), 3 days old, unwashed and desiccated (B), 2 days old, washed and desiccated (C), and 2 days old, washed and undesiccated (D).
FIG. 4
FIG. 4
Three scales of roughness on biofilms. (Top) Conceptual diagram. (Bottom) AFM height images of unsaturated P. putida mt-2 biofilms. Each of the three length scales provides different values for roughness, which probably vary due to the predominating surface feature at that scale: (A) within cells (0.5-μm scale), mesoscale structures of EPS determine roughness; (B) across 1 or 2 cells (2-μm scale), roughness is from EPS and boundaries between bacteria; (C) roughness averaged over many cells (5-μm and greater scale) is likely dominated by fluctuations in biofilm thickness and boundaries between bacteria.
FIG. 5
FIG. 5
Surface roughness (RMS) of unwashed, unsaturated P. putida mt-2 biofilms as a function of AFM scan size. The RMS roughness for similar biofilm age groups is displayed. Within each age group, n > 3; standard errors of the means are shown. Within each age group, roughness did not vary with sample preparation treatment.
FIG. 6
FIG. 6
Biofilm force map. (A) Diagram of the tip-sample interactions occurring as the AFM tip approaches and retracts from an adhesive surface. The force plot consists of two curves: one for the tip approaching the sample and one for the tip retracting from the sample. During the approach, the cantilever moves from right to left in the diagram, and the cantilever deflects as it presses into the biofilm. In the retract curve, the cantilever deflects sharply before separating from the biofilm as it moves from left to right in the diagram. The horizontal region of the curve represents the tip not in contact with the biofilm, and the sloped region of the curve represents the tip in contact with the biofilm. The slope for a hard surface is approximately 1 nm of deflection/nm of z distance, while softer surfaces show a more gradual deflection (33). (B) Force map analysis of unsaturated P. putida mt-2 biofilm. Biofilm was 2 days old, unwashed, and desiccated at 75.5% RH. Height image arrows show where example force plots were acquired. Lighter regions are higher than darker regions. Force map (force-volume image) shows patterns of adhesion on surface of biofilm. Darker regions are more adhesive than lighter regions. Arrowheads indicate pixels on force map where force plots were acquired. Scale bar indicates the x-y scales of the force map and height image. Force-versus-distance curves on cell surface (left) and between cells (right) show the large adhesion on the bacterial surface and small adhesion between bacteria. Vertical bars on force plots show the z position represented in the force map (= 50 nm above the position of maximum cantilever deflection into surface). Scale bars give x and y dimensions of force plots.

References

    1. Arnoldi M, Kacher C M, Baeuerlein E, Radmacher M, Fritz M. Elastic properties of the cell wall of Magnetospirillum gryphiswaldense investigated by atomic force microscopy. Appl Phys A. 1998;66:S613–S617.
    1. Beech I B. The potential use of atomic force microscopy for studying corrosion of metals in the presence of bacterial biofilms—an overview. Int Biodeterior Biodegrad. 1996;37:141–149.
    1. Bishop P L, Gibbs J T, Cunningham B E. Relationship between concentration and hydrodynamic boundary layers over biofilms. Environ Technol. 1997;18:375–386.
    1. Bremer P J, Geesey G G, Drake B. Atomic force microscopy examination of the topography of a hydrated bacterial biofilm on a copper surface. Curr Microbiol. 1992;24:223–230.
    1. Bustamante C, Keller D. Scanning force microscopy in biology. Phys Today. 1995;48:32–38.

Publication types

MeSH terms

LinkOut - more resources